
Utility workers make decisions every day. Some are routine, and some have real consequences for reliability, budgets, and customers. Today, those decisions don’t have to rely on experience and instinct alone. With better access to data and analysis tools, public power utilities are making more informed calls about what to fix, what to replace, and where to invest next.
Scoring Greater Impact
Managers at Northern Wasco County PUD in Oregon attach a numeric score to every project they consider. They create the score by measuring how projects align with strategic initiatives, such as implementing innovative technology to enhance service delivery or modernizing infrastructure to increase reliability.
Jeff Teel, chief operating officer for the PUD, considers the process of assigning scores both an art and a science. “For every one of our initiatives, we work with a consultant to translate the project into dollars because we need some sort of common unit to compare one area with another,” he explained. “How do you convert technological innovation to dollars? There’s a lot of going back and forth.”
Data plays a big part in the equations. For instance, Teel said the PUD can calculate the cost of an outage at every protective device in the system because the utility’s advanced metering infrastructure and geographic information systems clarify how much load is downstream from the breaker or fuse that’s down. After working with a wildfire consultancy, the team also knows ignition risk at every point in the system and can calculate risk to both utility and community assets.
Engineers at Traverse City Light & Power in Michigan also use a scoring technique to prioritize equipment maintenance and replacements. “We have an AMI system, and we’re using meter data for customer usage. We use the GIS for installation dates for wires, poles, and such. We also use reliability data from our outage management system,” explained Tony Chartrand, the utility’s director of electric engineering and operations.
All these data points feed into the stochastic energy development system created by the National Laboratory of the Rockies to help utilities simulate new technologies, demand shifts, and capacity additions in their systems.
TCLP’s engineering team reviews the analytics and compiles the scoring for potential projects. Factors that lead to a high score and elevated priority include those that address capacity issues or support reliability, whether TCLP has access to the equipment, and age, as the utility has some conductors that are more than 100 years old.
After scoring potential projects for prioritization, the TCLP team applies a defined methodology that includes field inspection and more data review. “Our scoring system tells us if this is an area we should focus on,” said Chartrand. “Then we have to determine what we need to replace and what we can reuse to keep project costs down.”
If, for example, the utility is looking at rebuilding a section of line, there’s a checklist of questions to be answered, such as: Is the conductor over a certain age? Does it show frayed strands, evidence of charring, or arc damage? Do AMI data show overloading? Do outage data indicate faults on the line?
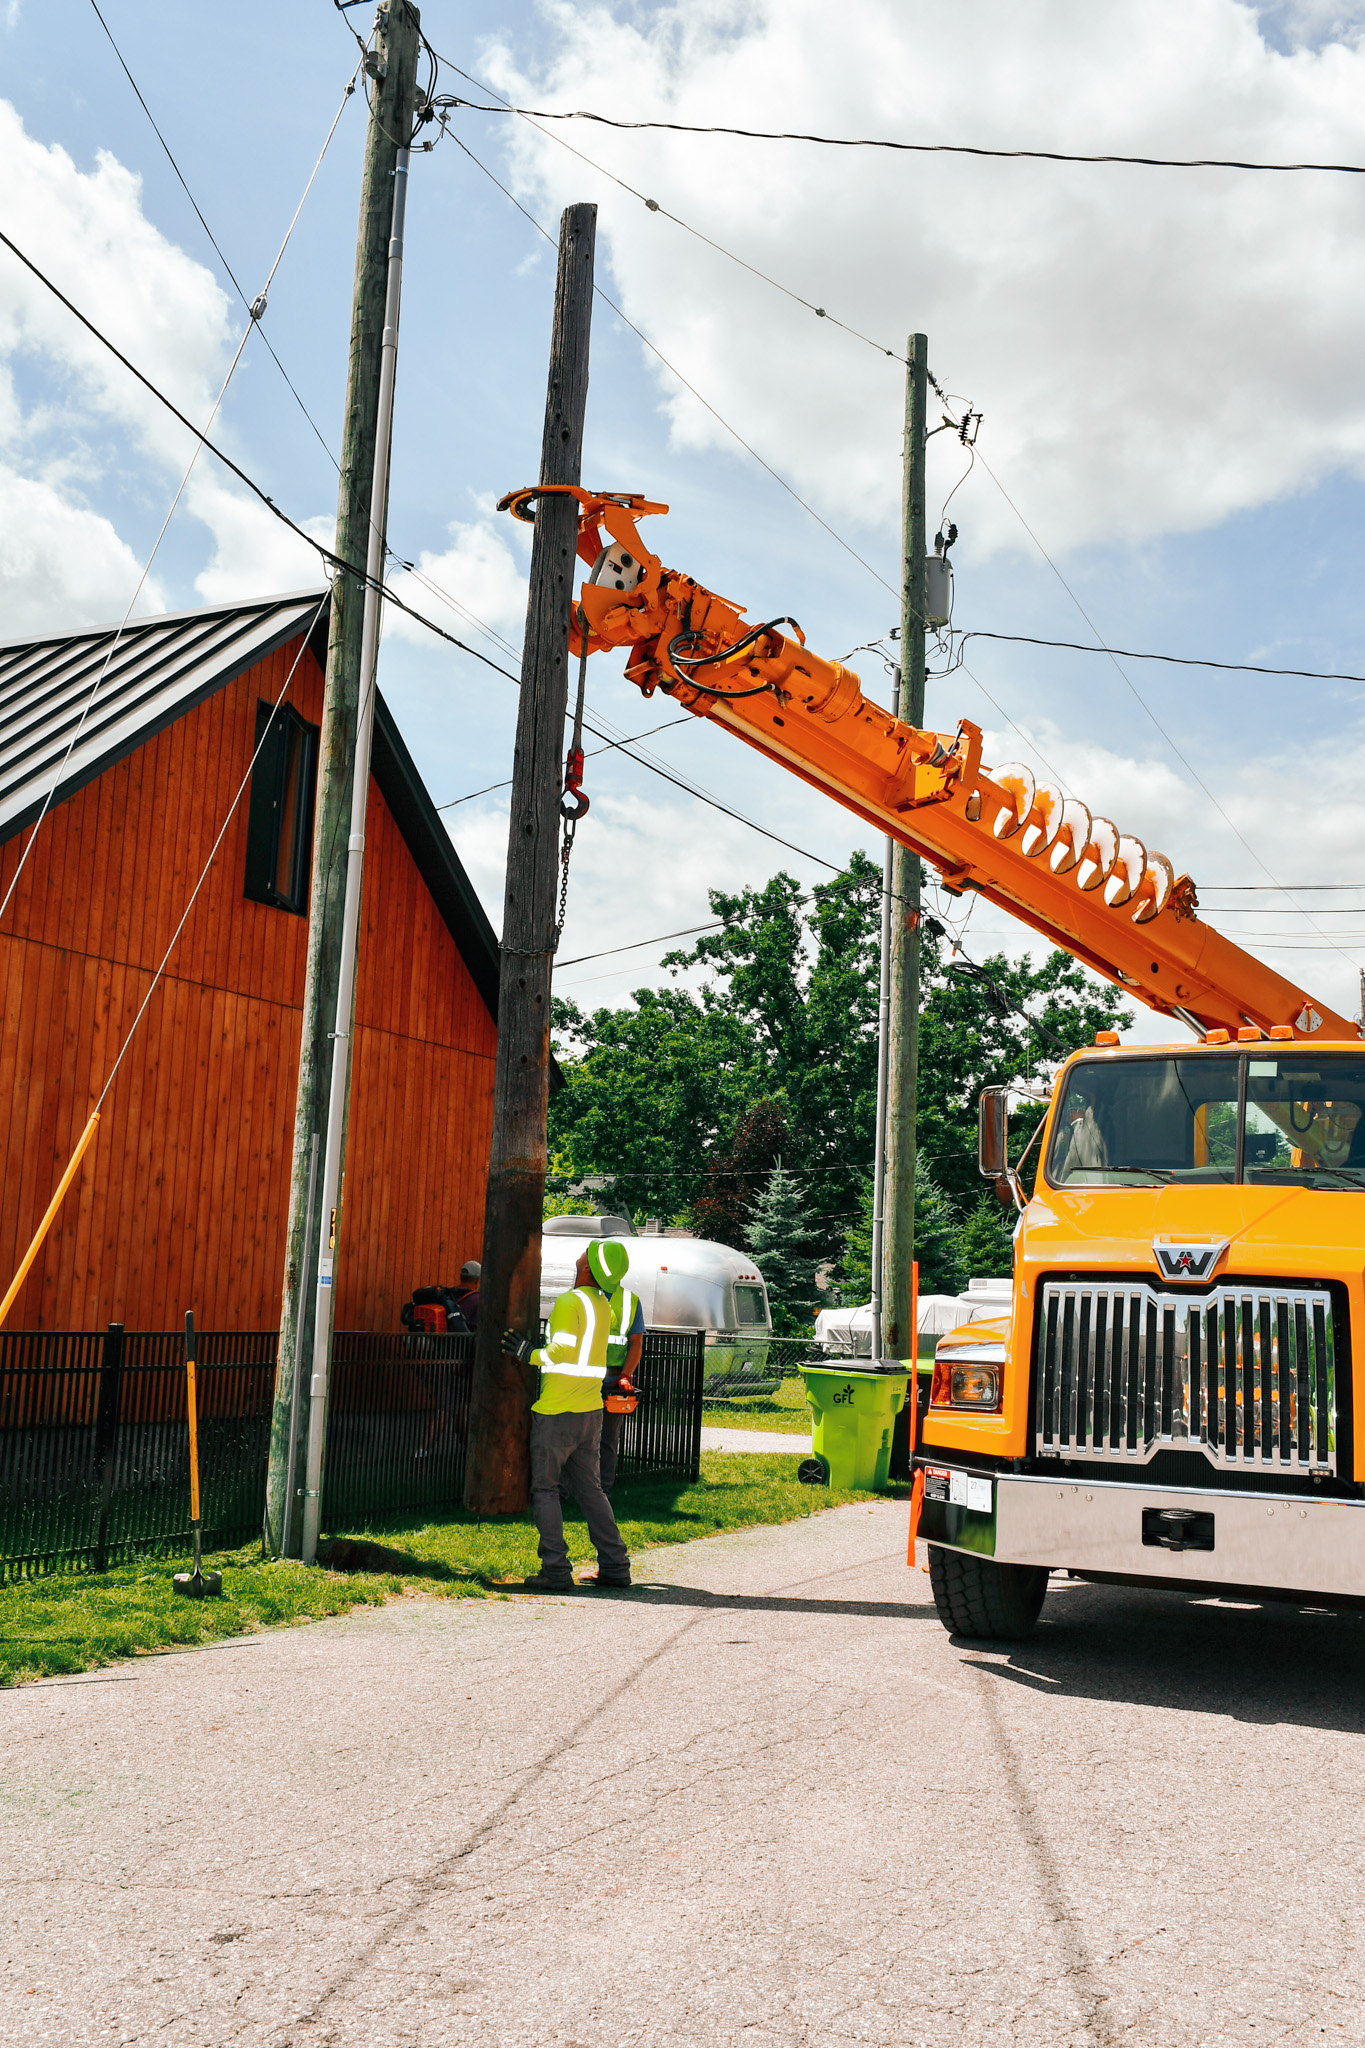
Chartrand said that this approach has decreased the costs of projects TCLP undertakes. In one project, the city was widening an alleyway, which meant that power lines had to be moved. Rather than replace everything at once — something Chartrand said he has seen many utilities do as a matter of course — TCLP crews evaluated which equipment could be reused. The project would have cost $178,600 if all transformers and conductors had been replaced, but by reusing still-reliable equipment, Chartrand’s team spent only $36,000.
At the same time, the team also updates GIS models with information found in the field. “The idea is to constantly update the main model as we’re doing projects,” he said. “It will help us identify what needs replacement today and what will age out later.”
Making Smarter Decisions
Teel has also been able to make better data-driven decisions at Northern Wasco County PUD, particularly around reliability, since the utility integrated the American Public Power Association’s PowerTRX Reliability tracking and analysis platform with its SCADA system.
“This was an intentional decision to improve visibility and understanding of outage indices throughout the organization,” Teel said. “Now, reliability indices are something our people see every day.”
He added that integrating PowerTRX Reliability helped the utility automate outage tracking. “The AMI system reports outages to the outage management system, so there’s less human involvement in recording events. It’s more accurate and less labor-intensive.”
The constant reliability tracking helped Wasco PUD engineers see the effect one substation outage had on its overall indices. In the case it examined, the cause was a raccoon that had been searching for bird eggs atop a transformer and the contact led to a long, widespread outage.
“We realized that yes, this is infrequent, but it could happen again, and it has a major impact, so it’s worth spending staff resources to investigate a solution,” Teel said. That solution was found by the utility biologist, who knew that a harmless chemical made from grapes creates a scent that people can’t detect but birds find loathsome. The chemical drove the birds out of the substation, leaving raccoons without a reason to stick around.
In another instance, the team identified a particular outage-prone section of line. Though it was scheduled for rebuilding, the permitting process would delay the project by two years, so PUD engineers added another recloser and dramatically reduced its outage frequency in the interim.
The data also help Teel explain investments. When utility engineers decided to replace aged #6 copper wire in the distribution system, the numbers showed why. “It’s prone to breaking, especially in the winter if there’s any snow or ice load on it,” Teel said. “This wire caused a lot of impact on our reliability. Being able to convey that visually helped us impart to the board why investing in replacement wire matters.”
Future-Proofing the Utility
Replacing wires and other grid assets may help next year’s reliability indices, but utilities also need to think and plan for long-term service and affordability.
“Utilities often think about making investments that need to last for 50 years or more,” said Jordan Branham, Ph.D., leader of Argonne National Laboratory’s Natural Hazard Analytics and Resilience Group. This is why Branham’s team works with utilities and other infrastructure-based organizations on using ClimRR, a modeling tool that forecasts future weather conditions for 12-by-12 kilometer tracts of land.
The tool incorporates modeling expertise from across the globe via the World Climate Research Programme. Normally, scientists run models reflecting 100-by-100 km grid cells, so Branham and his team scaled the data down to a higher spatial resolution using supercomputing at Argonne to provide actionable insights for utilities and other ClimRR users. Now, utilities can forecast what weather conditions may be like as far out as 2090.

“It’s pretty incredible how these models can be used to assess potential impacts to infrastructure,” Branham said. “We’ve evaluated potential direct risks to transmission lines, distribution lines, and substations, as well as potential changes in things like flooding and high-wind events.”
He added that his group has also evaluated how ratings of future grid elements may need to change. “For example, ratings for different transmission components might need to be tweaked in the future because there could be more high-heat events that coincide with low-wind events, so transmission lines may not be able to cool down,” Branham said.
Right now, Argonne is in the second year of a two-year collaboration with APPA to pinpoint future wildfire risks and work with public power providers on mitigation strategies. Charles Doktycz, Ph.D., is the Argonne research analyst who helps lead this effort. “We’re working directly with public power utilities to understand what data they need so they can build out their wildfire mitigation plans,” he said.
Now in the second cohort of APPA members who volunteered to work with Doktycz and his team, each participating utility gets a tailored wildfire risk profile report. “This is especially useful for utilities serving smaller service territories,” he said, “because off-the-shelf maps or national maps aren’t as useful for local-level planning.”

Some utilities Doktycz is working with also are looking at how specific species of vegetation might be affected by various weather factors and wood-destroying pests. In the Pacific Northwest, for instance, a utility is examining how hotter summers and reduced precipitation will affect the health of Douglas Fir trees in its territory.
Likewise, a Colorado utility is concerned about mountain pine beetles that kill pine trees and create large swaths of dead forest, increasing wildfire fuel and affecting forest hydrology. “Temperatures in the midcentury are going to increase in shoulder seasons. Those warmer spring and fall temperatures provide a more suitable climate for the mountain pine beetle to emerge, potentially giving them a whole second spawning season,” Doktycz explained.
The Argonne experts have been holding weather resilience workshops for public power providers across the country. In addition, the ClimRR maps are online and available to the public, and the laboratory’s team is willing to answer questions from utilities and other entities using them. “We’ve been trying to build our portal to be as useful as possible,” Doktycz said. “It doesn’t do any good just sitting there with pretty colors and data.”
This view is similar to Teel’s attitude about the data his utility examines. “It’s not about the data,” he said. “It’s about what you do with data and how you use it to tell a story.”