
As the demand for electricity rises across the U.S., generators are looking to bring more supply online. Here’s a general outlook by regional transmission organization of current capacity, projected near-term additions (capacity under construction or permitted as of 2024) minus retirements, and how that compares to projected demand through 2029.
Outlook by Regional Transmission Organization
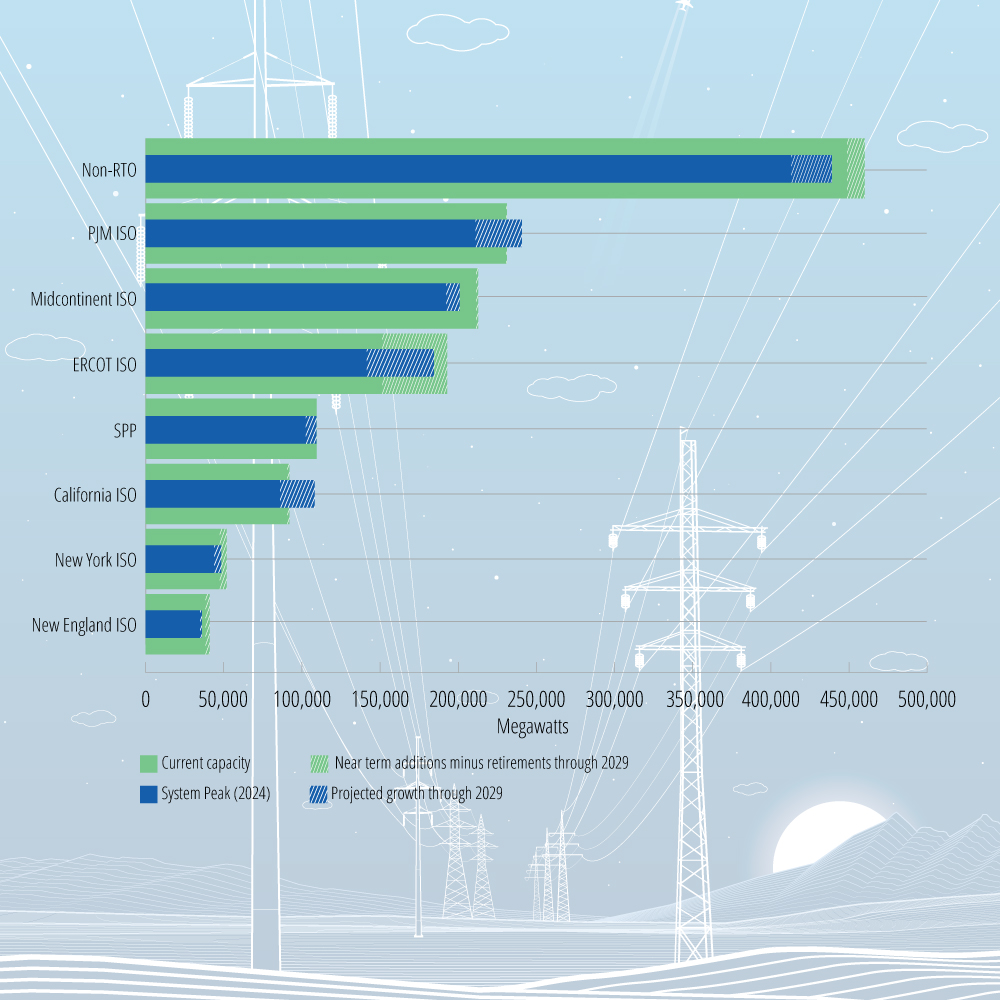
| Region |
Current Capacity |
Near-term Additions Minus Retirements (through 2029) | System Peak (2024) | Projected Growth Through 2029 |
|---|---|---|---|---|
| Non-RTO | 448,853 | 460,788 | 413,094 | 438,994 |
|
PJM |
230,853 | 231,442 | 211,078 | 240,678 |
| Midcontinent ISO | 211,374 | 212,620 | 192,457 | 201,557 |
| ERCOT | 151,454 | 192,828 | 141,591 | 184,391 |
| SPP | 109,305 | 108,461 | 102,685 | 108,985 |
| California ISO | 90,627 | 91,986 | 86,030 | 108,030 |
| New York ISO | 47,308 | 51,953 | 43,921 | 48,521 |
| New England ISO | 38,375 | 41,044 | 34,823 | 36,083 |
Sources:
Hitachi Energy Velocity Suite database, accessed January and February 2025.
“Strategic Industries Surging: Driving US Power Demand.” Grid Strategies, December 2024.
“2024-2033 Forecast Report of Capacity, Energy, Loads, and Transmission.” ISO New England, May 2024.
“2029 Local Capacity Study” California ISO, April 2024.
Learn more about trends in generating capacity in our America’s Electricity Generation Capacity report.