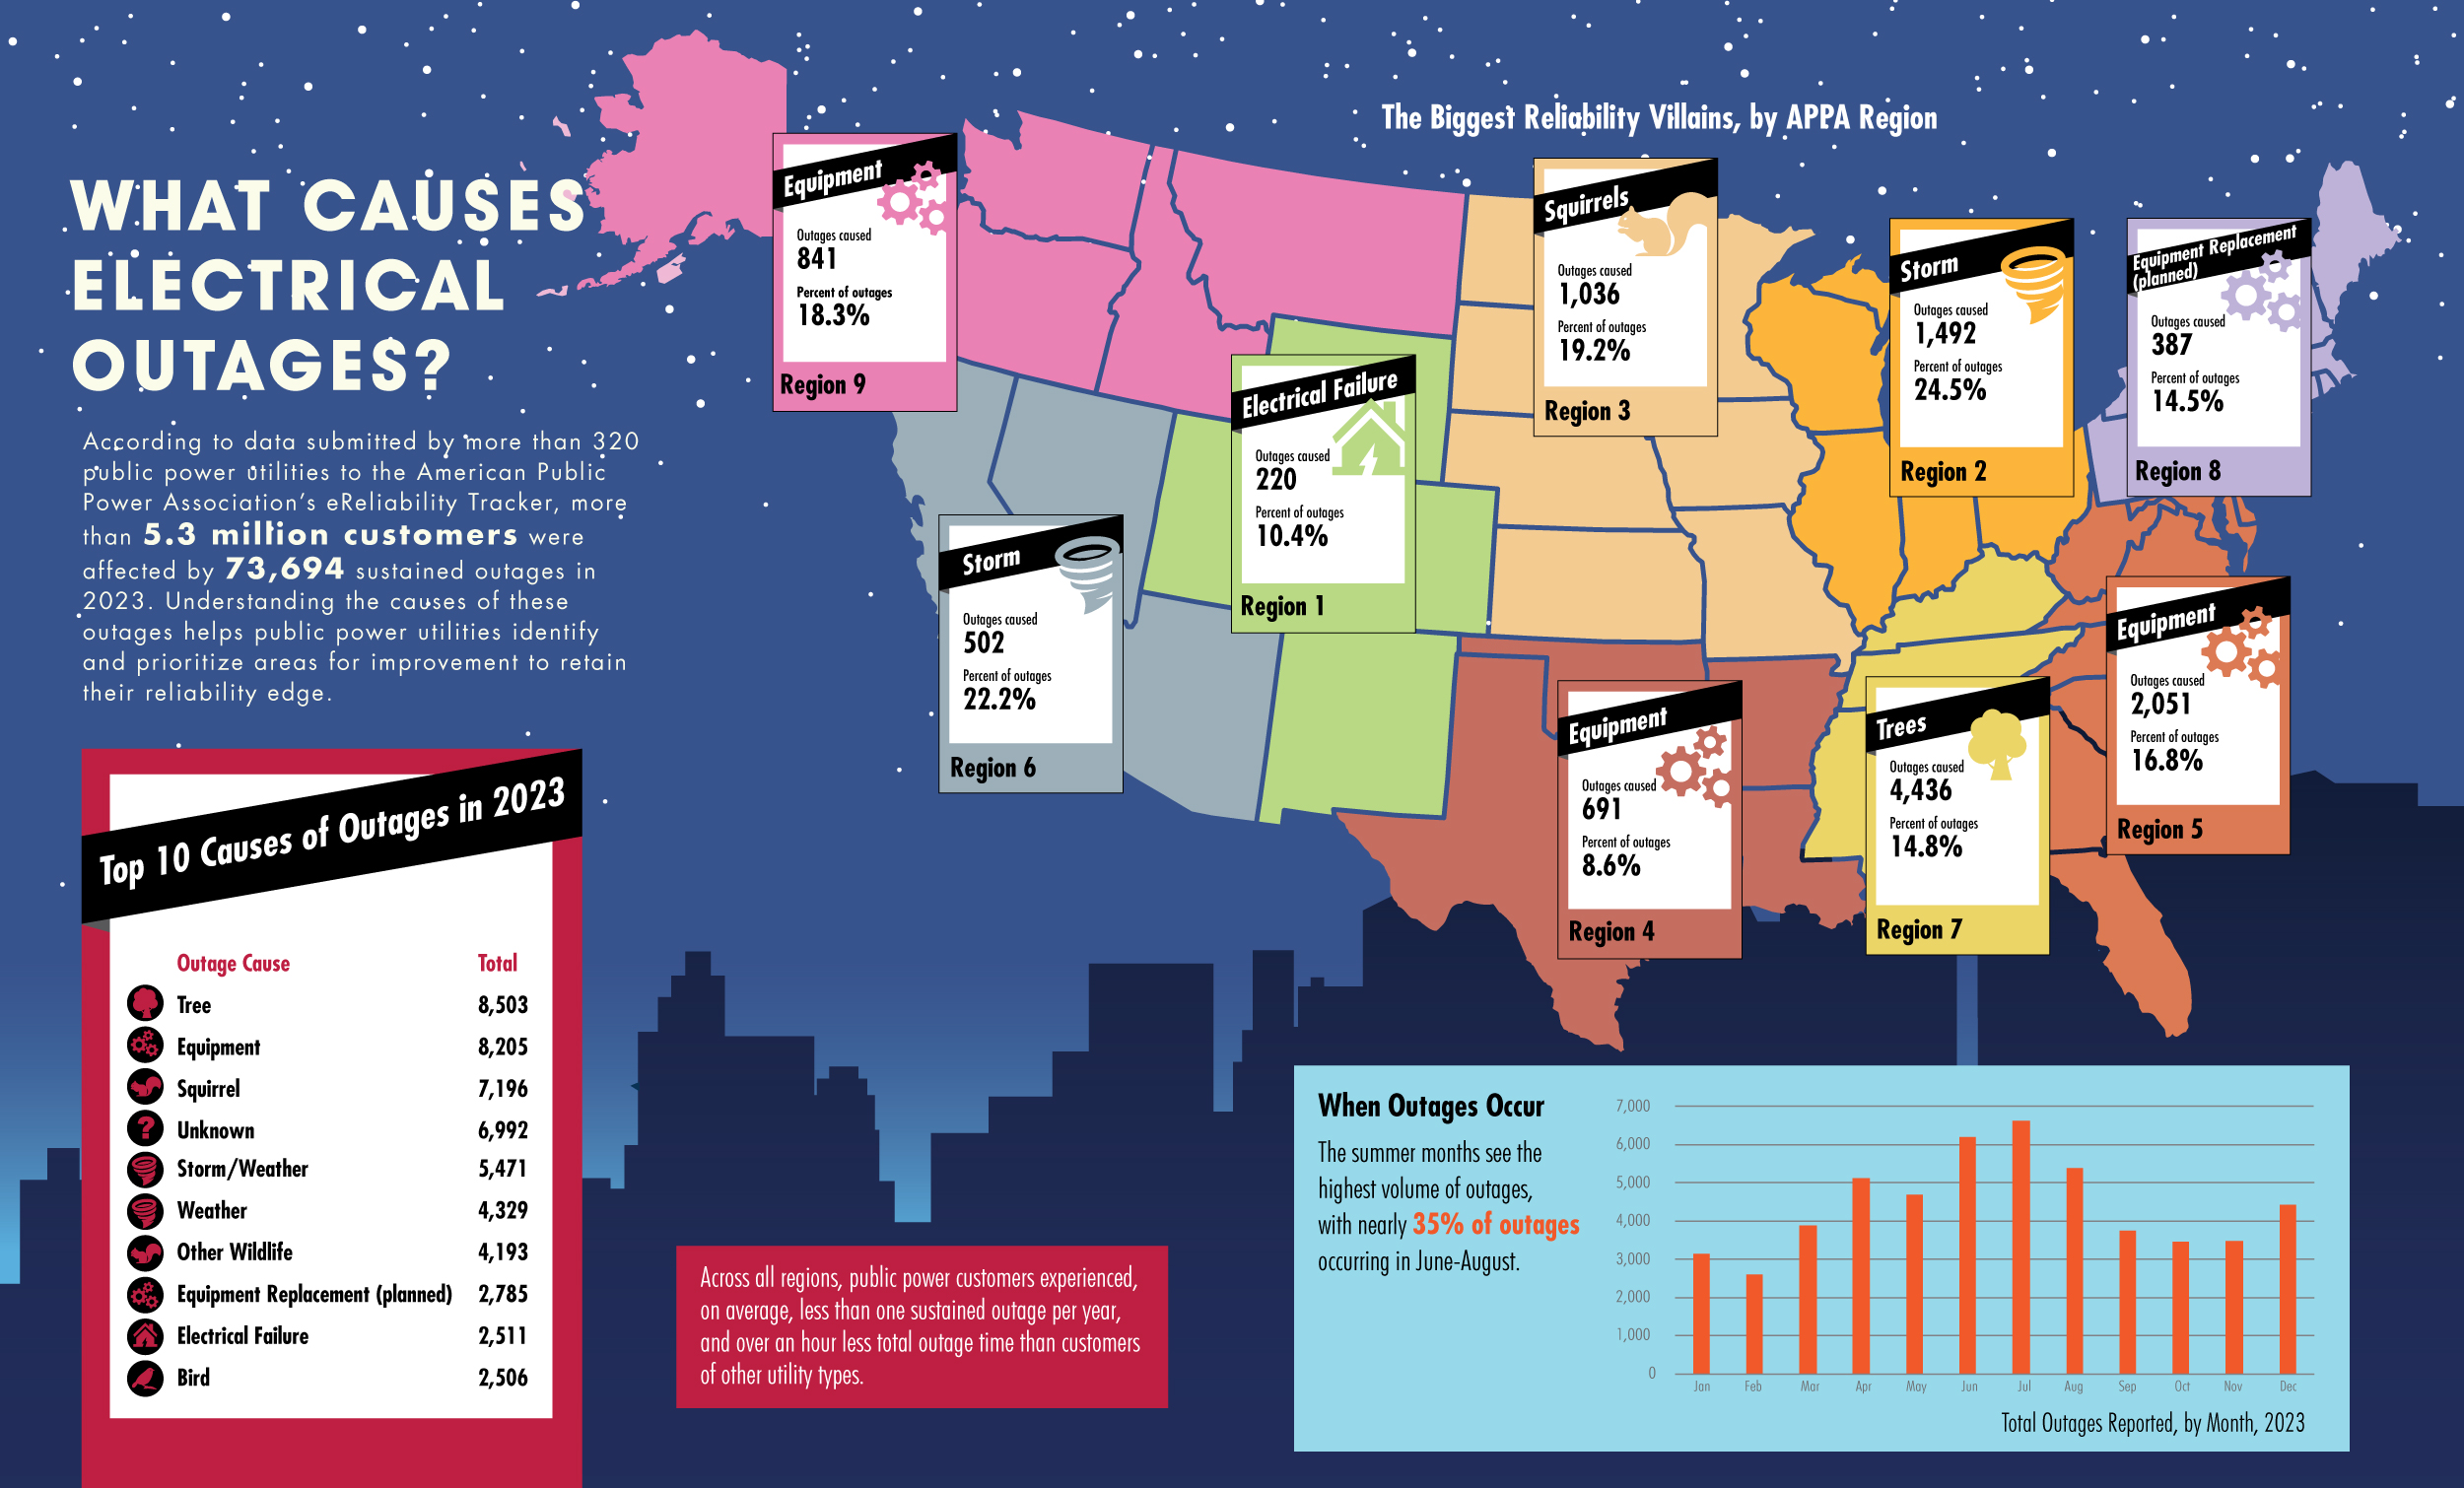
According to data submitted by more than 320 public power utilities to the American Public Power Association’s eReliability Tracker, more than 5.3 million customers were affected by 73,694 sustained outages in 2023. Understanding the causes of these outages helps public power utilities identify and prioritize areas for improvement to retain their reliability edge.
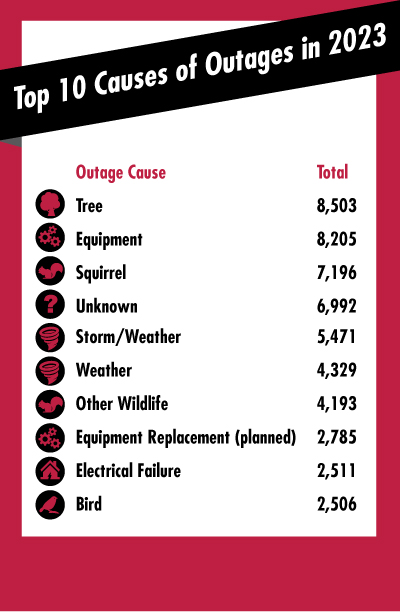
Top 10 Causes of Outages in 2023
| Outage Cause | Total |
|---|---|
| Tree | 8,503 |
| Equipment | 8,205 |
| Squirrel | 7,196 |
| Unknown | 6,992 |
| Storm | 5,471 |
| Weather | 4,329 |
| Other Wildlife | 4,193 |
| Equipment Replacement (planned) | 2,785 |
| Electrical Failure | 2,511 |
| Bird | 2,506 |
Across all regions, public power customers experienced, on average, less than one sustained outage per year, and over an hour less total outage time than customers of other utility types.
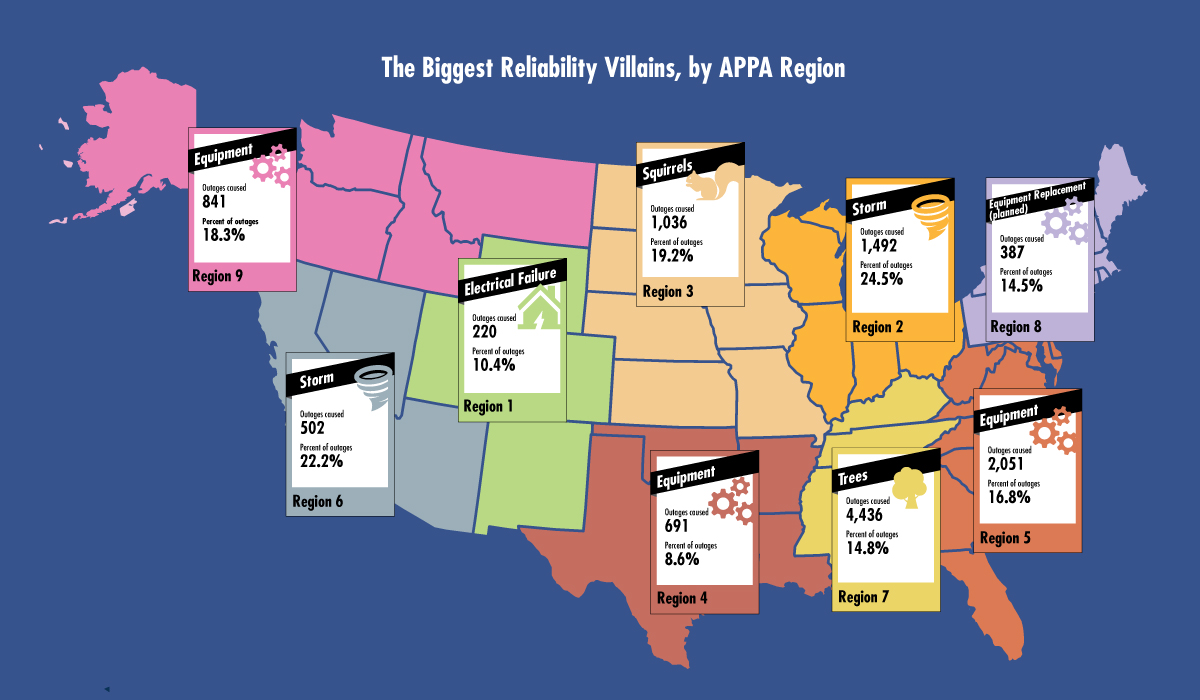
The Biggest Reliability Villains, by Region
|
Region |
Top Outage Cause | Outages by Top Cause | Percent of Outages |
|---|---|---|---|
| 1 | Electrical failure | 220 | 10.4% |
| 2 | Storm | 1,492 | 24.5% |
| 3 | Squirrels | 1,036 | 19.2% |
| 4 | Equipment | 691 | 8.6% |
| 5 | Equipment | 2,051 | 16.8% |
| 6 | Storm | 502 | 22.2% |
| 7 | Trees | 4,436 | 14.8% |
| 8 | Equipment Replacement (planned) | 387 | 14.5% |
| 9 | Equipment | 841 | 18.3% |
No data for Region 10, which includes the five U.S. territories.
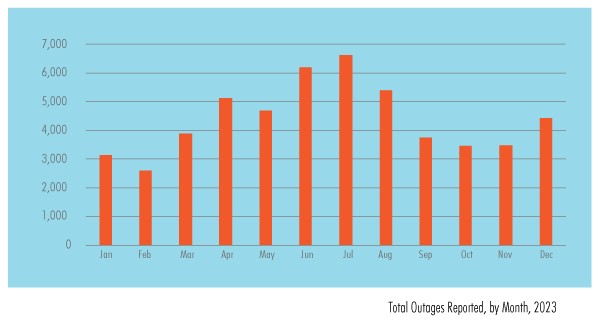
When Outages Occur
The summer months see the highest volume of outages, with nearly 35% of outages occurring in June-August.
Download and share the full graphic.
