By Joe Cocklin, Manager, Rates & Analytics, Lincoln Electric System, Nebraska
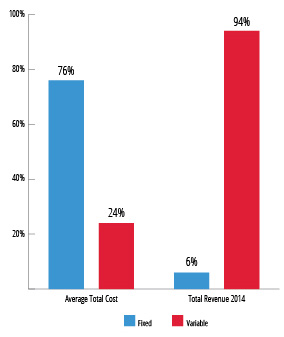
In late 2015, after experiencing flattening load growth for several years despite customer growth, Lincoln Electric System (LES) undertook a project to assess the recovery of fixed costs through a restructuring of its non-demand rates. At the time, 94% of its revenue was recovered in variable rates.
| Lincoln Electric System | Lincoln, NE and surrounding communities |
| Customer Meters | 150,000 |
| Customer Profile | 88% residential |
| 2023 Sales | 3,300,000 megawatt-hours |
| Annual Peak | 770 megawatts |
| Generating Mix | 35% natural gas, 31% coal, 34% renewables, including wind, hydro, solar, and landfill gas
|
| Governance | Semi-autonomous administrative board appointed by the mayor. Budget, rates, and financing require city council approval. |
Figure 1. Cost Recovery for Non-Demand Rate Classes, 2014
Due to post-recession improvements in energy efficiency and new regulatory standards, non-demand customers individually were using less energy over time. Under this new trend, it became imperative for LES to insure against the risk of recovering insufficient revenue to cover fixed costs. But without advanced metering infrastructure and no immediate plans to implement it, LES had to come up with a creative way to shift more of its fixed costs into fixed rates while also minimizing the impact to its customers.
At the time, LES had a fixed customer and facilities charge for residential customers. In 2017, this was broken apart to offer more transparency into what costs were being recovered in which charge.
| Rate Change | Implemented demand-based fixed facilities charge for residential customers |
| Goals | Realign rates with fixed and variable costs; maintain customer satisfaction and trust; equitable distribution of costs |
| Key Results | Shifted $53 million from variable to fixed charges; developed rate impact analysis framework |
Figure 2. Fixed and Variable Charges and Costs
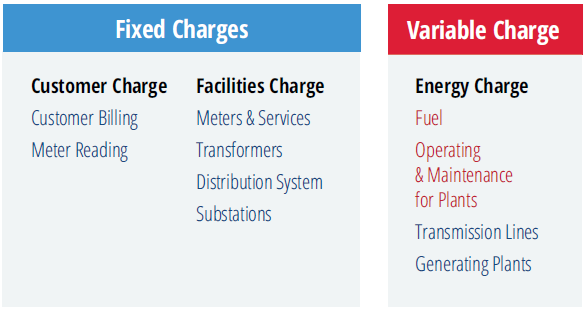
The initial plan was to only tackle the movement of the costs associated with the distribution system and substations. At the time, this represented $17.4 million of costs just for residential customers.
LES underwent a process of brainstorming and analysis to understand how different customer strata within the residential class used the system. Using internal load survey data, as well as income and demographic data from an outside vendor, LES analyzed consumption patterns by income level, dwelling square-footage, household size, heating type, and ownership type. This gave the project team useful insights into how usage patterns differed among various customer groups.
Through different analyses, it was determined that residential customers would be assigned to one of three different monthly usage levels, based on their previous 12 months’ average energy usage. The level ranges are:
- Level 1: 0 kWh – 800 kWh
- Level 2: 802 kWh – 1,500 kWh
- Level 3: 1,501 kWh and above
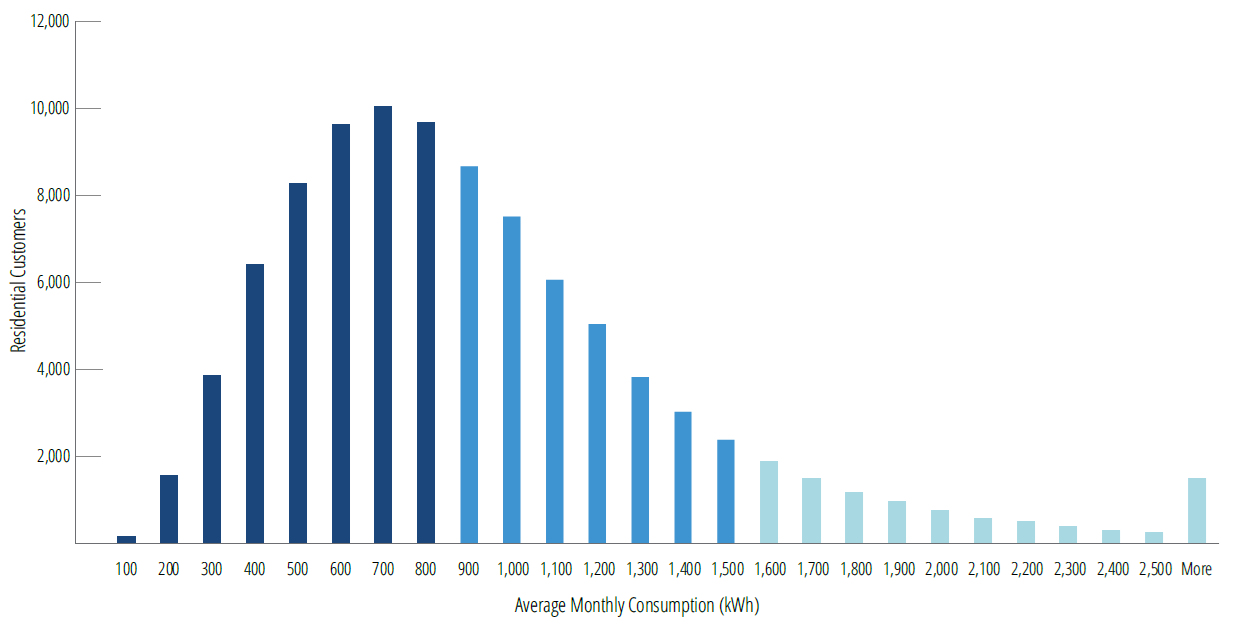
The analysis revealed that, while over half of LES residential customers had an average usage of less than 800 kWh per month, more than three-quarters of customers in multifamily dwellings — mostly apartment complexes and townhomes — were concentrated among this lowest usage level. Looking at LES infrastructure needs, it became apparent that multifamily dwellings required smaller transformers and their demand levels put less strain on substations. Furthermore, while each unit still required its own meter, multifamily units were more likely to use meter banks with fewer service drops than single-family dwellings.
Figure 3. Average Monthly Energy Consumption, Residential Customers, 2014
Using the stratified load research data of residential customers, LES was able to estimate each usage level’s contribution to system demand at the system peak.
Table 1. Estimation of Per-Customer Residential Demand by Level
| Level | Percentage of Residential Population | Demand per Residential Customer (kW) |
|---|---|---|
| 1 | 52% | 2.10 |
| 2 | 38% | 3.29 |
| 3 | 10% | 5.66 |
This informed the conclusion that levying a single facilities charge to all residential customers would not be equitable, as it disproportionately burdens lower-use customers. Instead, the allocated share was used to determine the facilities charge when adjusted for the population in the stratum, with the lowest charge to the Level 1 customers and the highest charge to Level 3 customers.
The benefit of this approach is that it still allows the customer some control over what they would be charged, as the level the customer is assigned to would be updated every year based on the previous 12 months of usage. New construction for single-family dwellings are assigned Level 2, while newly-constructed multi-family dwellings are assigned Level 1. New customers who move into a previously occupied dwelling would inherit the facilities level of the previous occupant. Customers who could meaningfully reduce their energy use could reduce their facilities charge along with their energy charge.
This structure also helped minimize the burden to lower-income customers. An analysis of income data showed that roughly three-quarters of households identified as low-income used less than 800 kWh a month, placing the bulk of those customers in Facilities Level 1. This gave LES additional confidence that this structure would minimize the negative impact to customers who potentially have a harder time paying their bills and bolstered the defensibility of this rate approach.
Given that such a restructuring of customer bills would be jarring if adjusted all at once, LES implemented a phased approach where the cost shift to the facilities charge would take place over several years. This meant the initial financial impact to the customer was minimized in the first year of the restructure and would gradually shift over time. Additionally, the cost shift would also see the energy charge reduced accordingly, so that the entire restructure would be revenue-neutral to LES.
Communication Plan
Once executive management and the administrative board approved the new rate structure, communicating the new structure to customers became an important element of the rate deployment. While large commercial and industrial customers tend to have a better understanding between energy and demand as a part of their operations, and how those elements are reflected in their bill, residential customers tend to have little exposure to the distinction.
LES’ communications team put together materials to include in customer correspondence and on the utility website (Figure 4). LES worked with various groups, including those representing customers with lower incomes, to ensure they understood the changes. LES assured stakeholder groups that the timeline of the phased implementation would be adjusted to minimize bill impacts in years where a system-wide rate increase might be required. As part of the implementation process, LES ran dozens of billing simulations each year to analyze the distribution of rate impacts and structure adjustments to minimize overall customer burden.
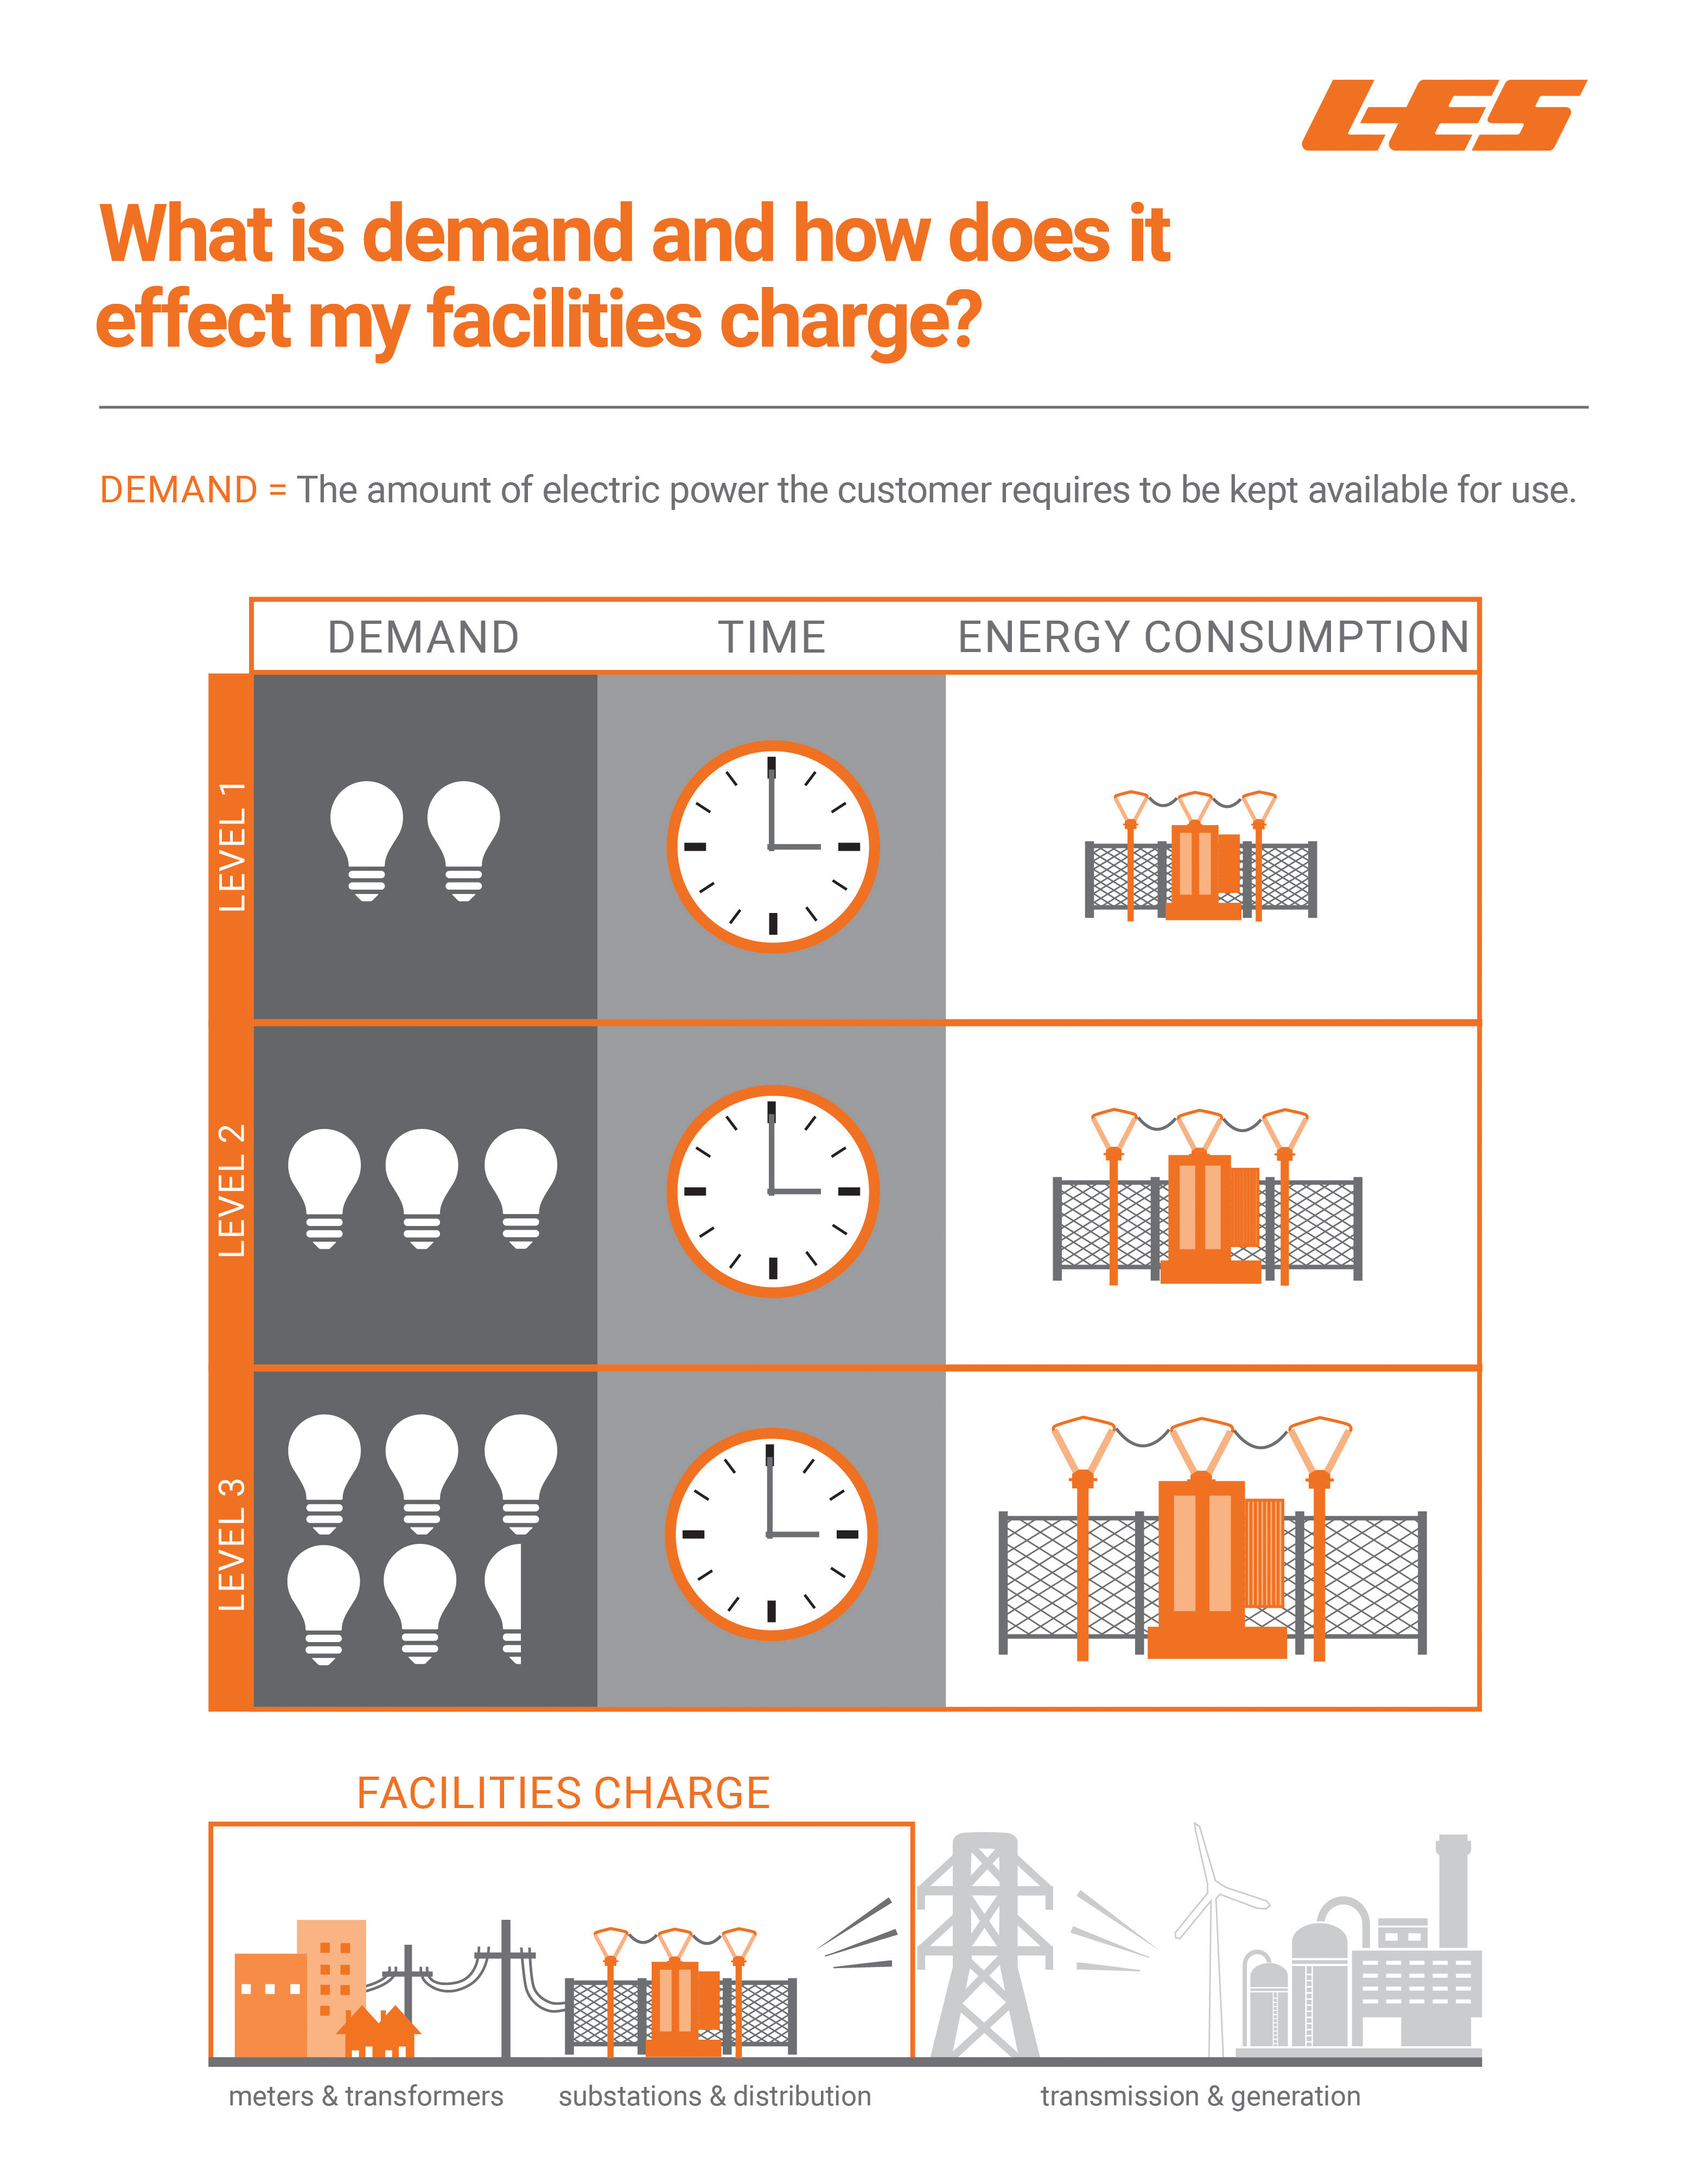
A slow, research-based, and thoughtful approach to implementation helped tremendously with customer reception of the changes. In the end, the new rate structure was implemented with little fanfare or public pushback. LES attributes its transparency, stable rates, and phased approach with helping to maintain trust with its customers.
Results
The implementation of the rate began in 2017, with the rate changes outlined in Table 2. The first phase primarily addressed distribution costs and moved approximately $30 million variable revenue into fixed revenue from 2017 to 2019. In the second phase, between 2022 and 2024, another $23 million in residential transmission costs were shifted into the facilities charge.
Table 2. Rate Evolution, 2016-2024

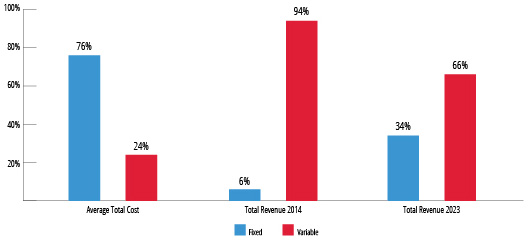
There is no immediate plan for addressing the movement of the remaining $51 million of capacity costs to the facilities charge. Despite that, over the course of the phased restructuring, LES succeeded in more closely aligning fixed costs and revenue from fixed charges, as shown in Figure 5.
Figure 5. Cost Recovery for Non-Demand Rate Classes, 2014 vs. 2023
Lessons Learned
Restructuring rates to put a utility in line with shifting currents in the industry is a daunting task, especially among public power utilities where there is significant goodwill that needs to be maintained between the utility and the community it serves. There is no shortage of articles and think-pieces on the blowback that utilities have received from their community when something as disruptive as a rate hike or a restructuring is proposed. Lessons from those experiences motivated LES to be proactive in addressing the shift in energy consumption before it started to see the financial impacts of this shift. This approach allowed LES to frontload its effort with detailed internal analysis and impact studies on various customer groups as well as assess its comfort level with implementation speed. Combined with a proactive communication plan and buy-in from stakeholder groups, this resulted in no damage of trust or goodwill between LES and the community at large.


