By Peter Dauenhauer, senior manager of rates, economics and energy risk management, Snohomish Public Utility District
Snohomish Public Utility District serves 377,000 residential customers in Washington state. It is the second largest consumer-owned utility in the Pacific Northwest, after Seattle City Light, and the 13th largest in the U.S. SnoPUD’s pilot with time-of-use rates was called FlexEnergy and had several goals:
- Assess how much peak load shifting can be induced by TOU rates.
- Establish local data on peak shifting and determine the value of distributed energy resources in the PUD’s service area. Although advanced rate pilots have been carried out for a long time in the U.S., relatively few were carried out in winter-peaking climates.
- Build up internal capacity for scoping up to larger-scale solutions, which would be a key element of the energy transition.
The TOU pilot was designed to test three pricing options across eight customer segments. The pricing options were:
- A TOU rate, based on an embedded cost-of-service study, with four winter-peaking months (November through February). During the peaking season there were two peaking periods of three hours, one covering the morning peak and one in the evening. Peaking prices were roughly twice the mid-peak prices. Mid-peak prices were set to the PUD’s standard energy tariff (10.47 cents per kilowatt-hour), and a 20% discounted off-peak price was conveyed during all evening, weekend, and holiday hours.
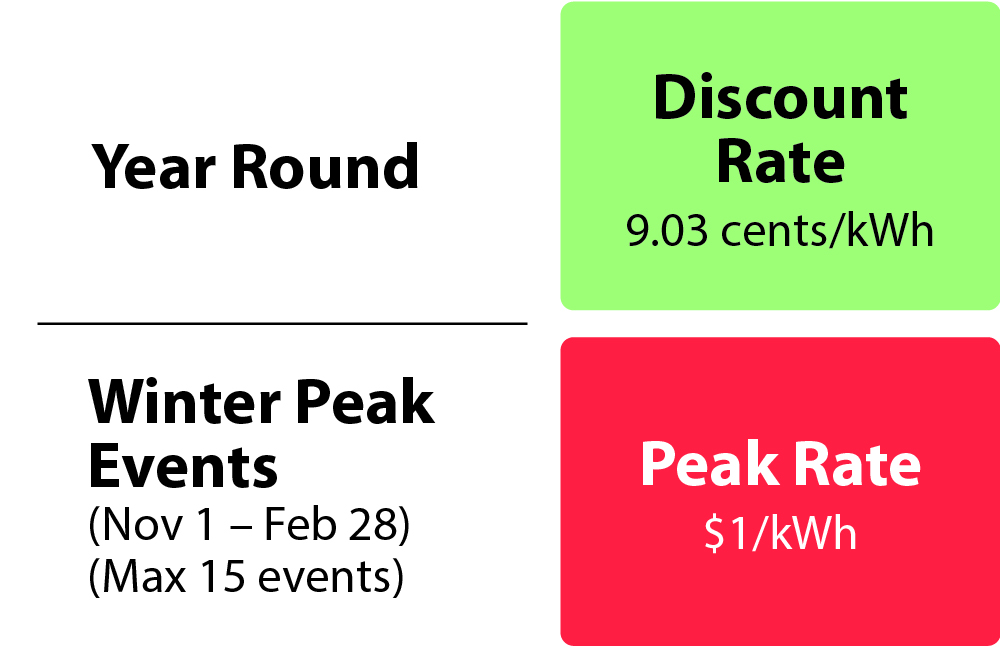
- A critical peak pricing, or CPP, rate targeted 50 day-ahead called event hours. This rate was designed to shift demand against peak-hour market risk exposure. The peak price was $1 per kWh during called event hours and a 10% discount during all other hours — yearlong.
- A simple incentive ($80/year) for utility control of an electric vehicle charger or a smart thermostat. To qualify for this segment, a customer had to own compatible technology that was set up to be automatically controlled by the distributed energy resource management system, or DERMS, during event calls. Like the CPP, there were up 60 event hours called per year, but customers could opt out during the event at no penalty.
Figure 1. SnoPUD’s time of use rate schedule
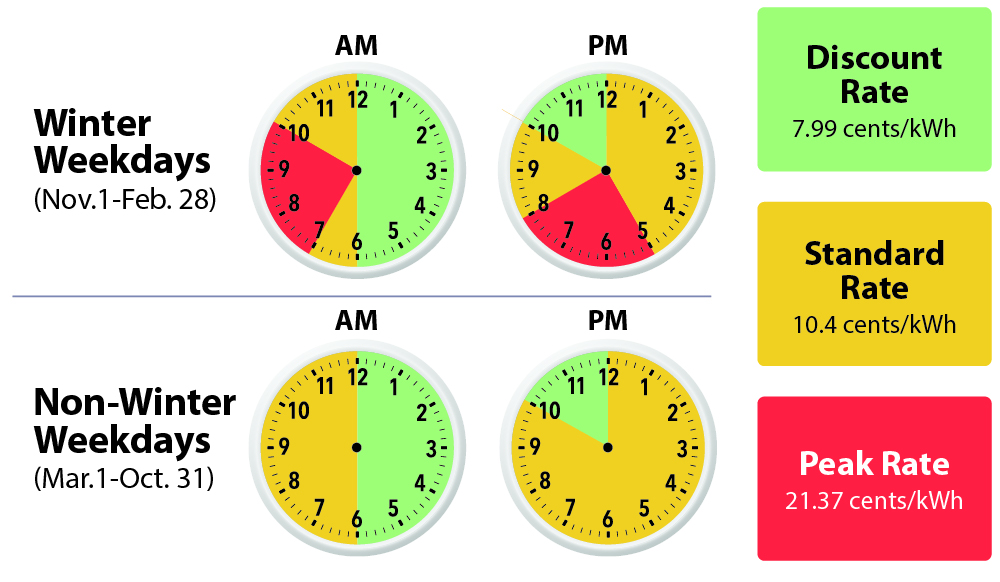
Figure 2. SnoPUD’s critical peak pricing
The PUD wanted the price signal to be a win-win for customers and the utility. Thus, the pilot was designed to send the right cost-based price signals to customers and to pair prices with tools that would facilitate load shifting (including smart thermostats and EV chargers) and behavioral messaging.
Pilot participants were segmented into two technology groups (those with EV chargers and those with smart thermostats) and a behavioral group with no DERMS-connected technology. The pilot included four smart device vendors (Google Nest, Ecobee, Enel X, and ChargePoint). The technologies were controlled by Virtual Peaker’s DERMS platform. At the end of the pilot, there were roughly 90 EV customers, 110 smart thermostat customers, and 300 customers with no connected technology.
For the control group, the PUD established a load research sample, consisting of more than 500 residential customers, for load forecasting purposes. Ideally, and with more time and staff availability, the PUD would have planned a randomized control trial or run the pilot for a year without a rate treatment. The PUD had to innovate on its design due to an upcoming advanced metering infrastructure deployment, limits in metering staff to deploy non-AMI interval meters before the pilot, and a short recruitment window (roughly four months). This dataset was used to collect comparison intervals over the pilot.
The utility preemptively added MV–90 probed interval meters on another 225 customers who had purchased EV chargers and smart thermostats through the PUD’s online marketplace, boosting the number of control meters to about 750. The PUD developed quasi-controls for each pilot participant using the prepilot load shapes versus the control meters and selected and blended up to five control meters per FlexEnergy meter to compare against.
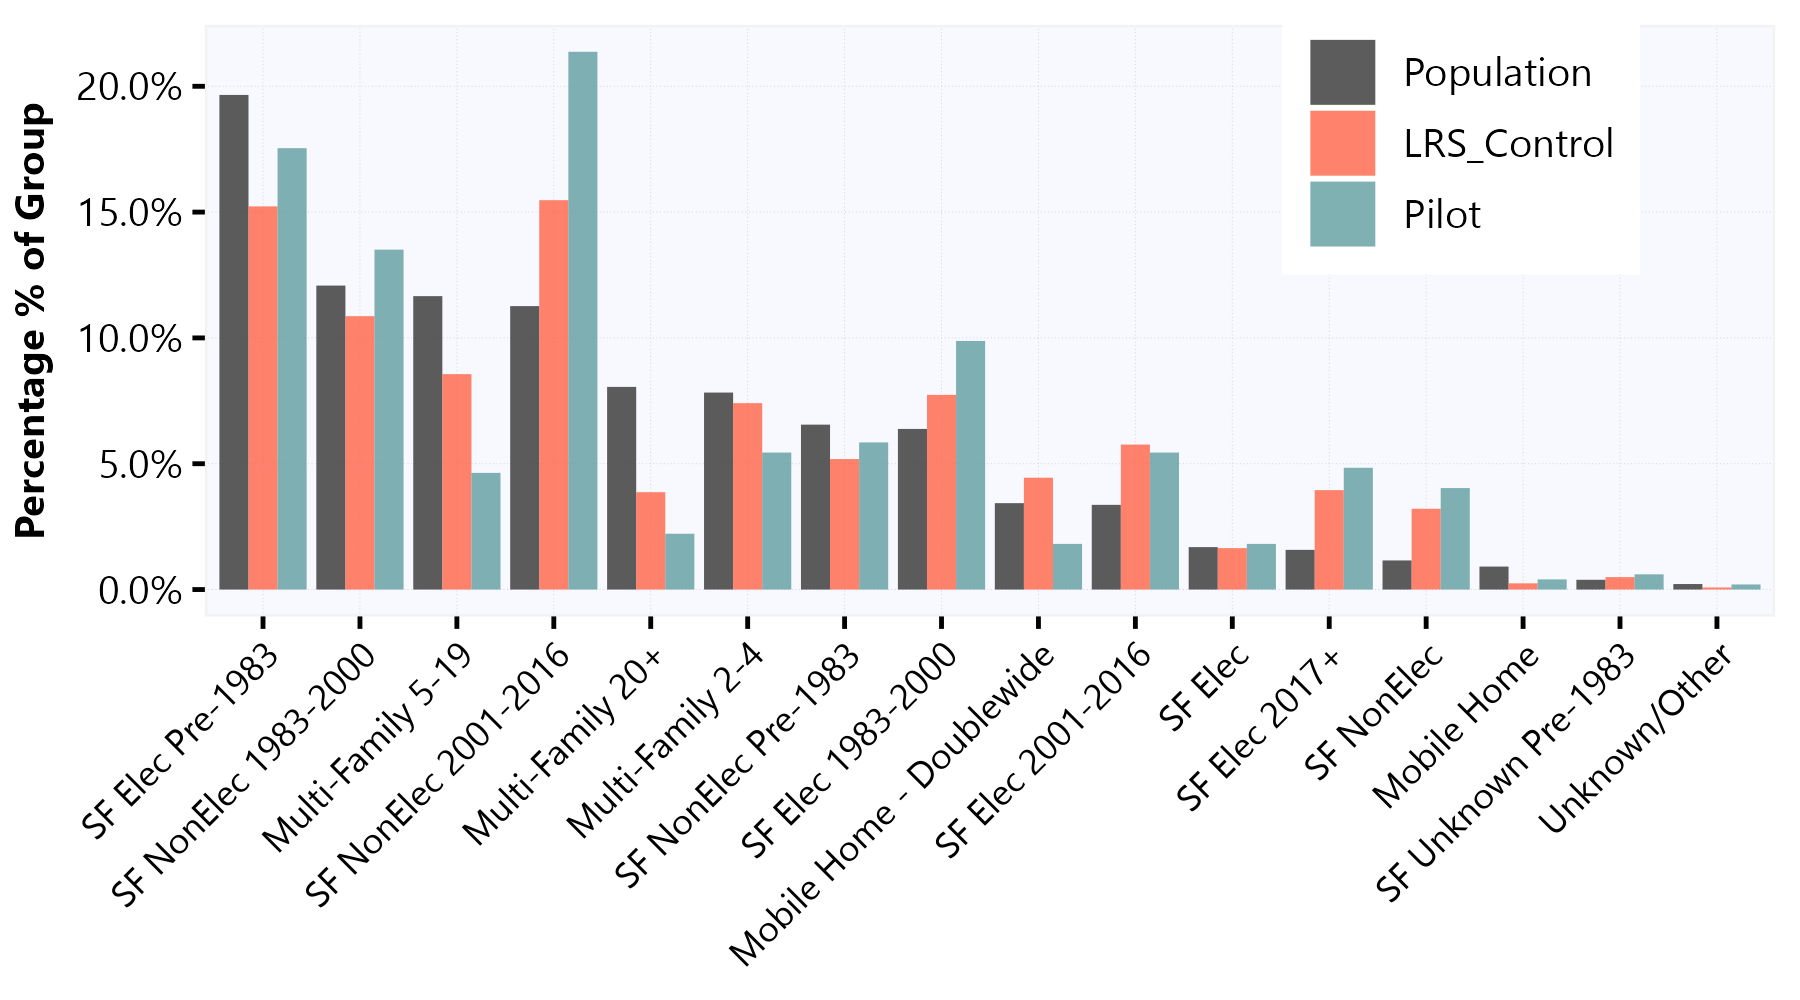
Customers were recruited through the PUD’s website, email lists, and social media. Prior to the official recruitment period (May–September 2021), customers could request to join a waitlist. Recruitment activities included targeted emails, magazine articles, external media, display advertisements, and customer device marketing. The PUD also recruited customers who had purchased devices from the PUD’s online marketplace to help fill distinct segments. Although the opt-in recruitment was not randomized, the customers in the pilot represented the larger segments within the utility’s overall population base (see Figure 3).
Figure 3. Population, control, and pilot proportions, by premise type
The pilot ran from October 2021 to March 2023 and encompassed two winter “peak seasons.” Initially, 575 customers were enrolled in the pilot. Because of attrition, largely from customers moving to other service areas, the number had dwindled to 497 by the time the pilot ended.
Results and What’s Next
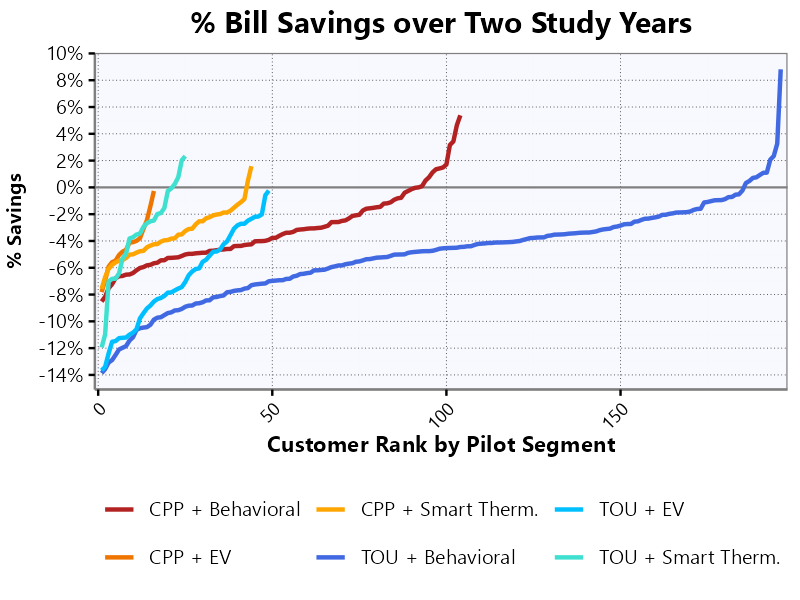
On average, customers in the two TOU rates saved $25–$40 over each year of the program, or roughly 3.8%–4.8% of monthly bills. Depending on the year of the pilot, peak shifting varied between 7% and 12% for the TOU rate, 25% and 33% for the critical peak pricing rate, and 7% and 12% for the demand response incentive. Irrespective of the pricing pilot, the utility captured self-reported ownership of various equipment types.
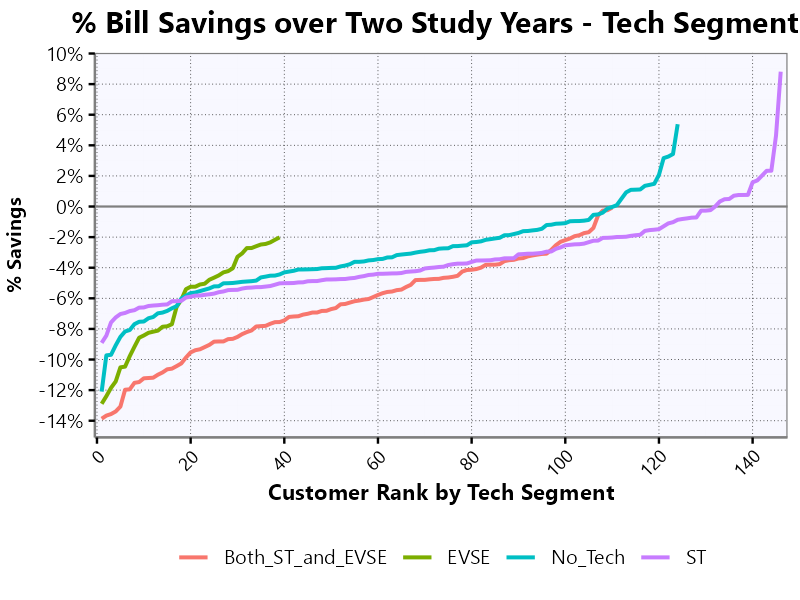
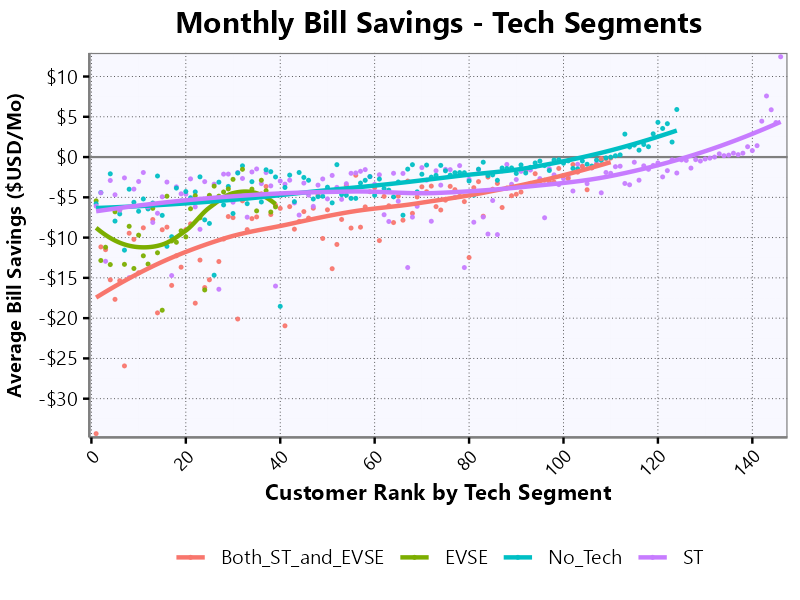
Average bill savings per customer for the TOU and CPP segments, both in dollars and as a percentage versus the utility’s standard rate, are shown in Figures 4–6. (“ST” refers to smart thermostat, and “EVSE” is electric vehicle supply equipment.) Customers who owned both types of equipment (red curve) had relatively positive bill outcomes — though only a small segment experienced worse outcomes after shifting. Customers without technology (teal curve) performed remarkably well overall, showing that behavioral-only peak shifting is viable for motivated customers.
Based on the encouraging results of the pilot, the PUD intends to move forward and offer a TOU rate to customers in 2025. Other time-varying rate options, including variable peak pricing, critical peak pricing, and peak time rebates, are also being reviewed.
Given the expected growth of EVs in the PUD’s service area over the next decade, attention is being given to implementing the right incentives for EV customers to charge their vehicles off-peak. TOU rates will be a key part of that strategy.

