
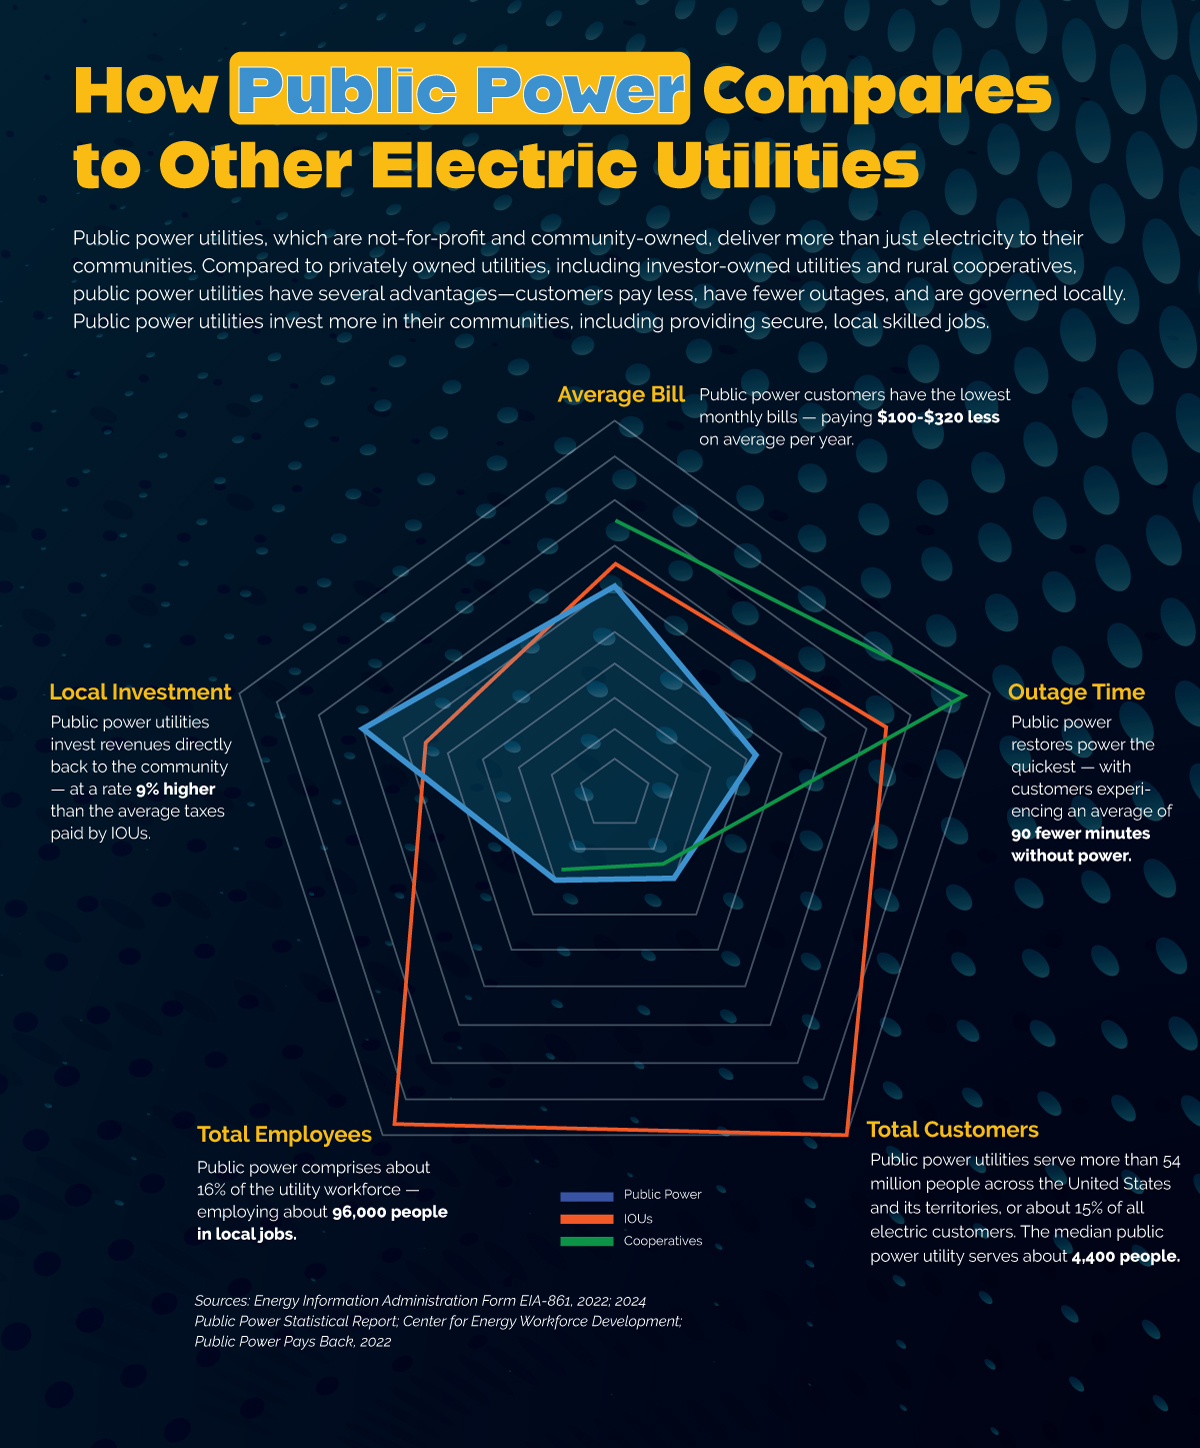
Public power utilities, which are not-for-profit and community-owned, deliver more than just electricity to their communities. Compared to privately owned utilities, including investor-owned utilities and rural cooperatives, public power utilities have several advantages – customers pay less, have fewer outages, and are governed locally. Public power utilities invest more in their communities, including providing secure, local skilled jobs.
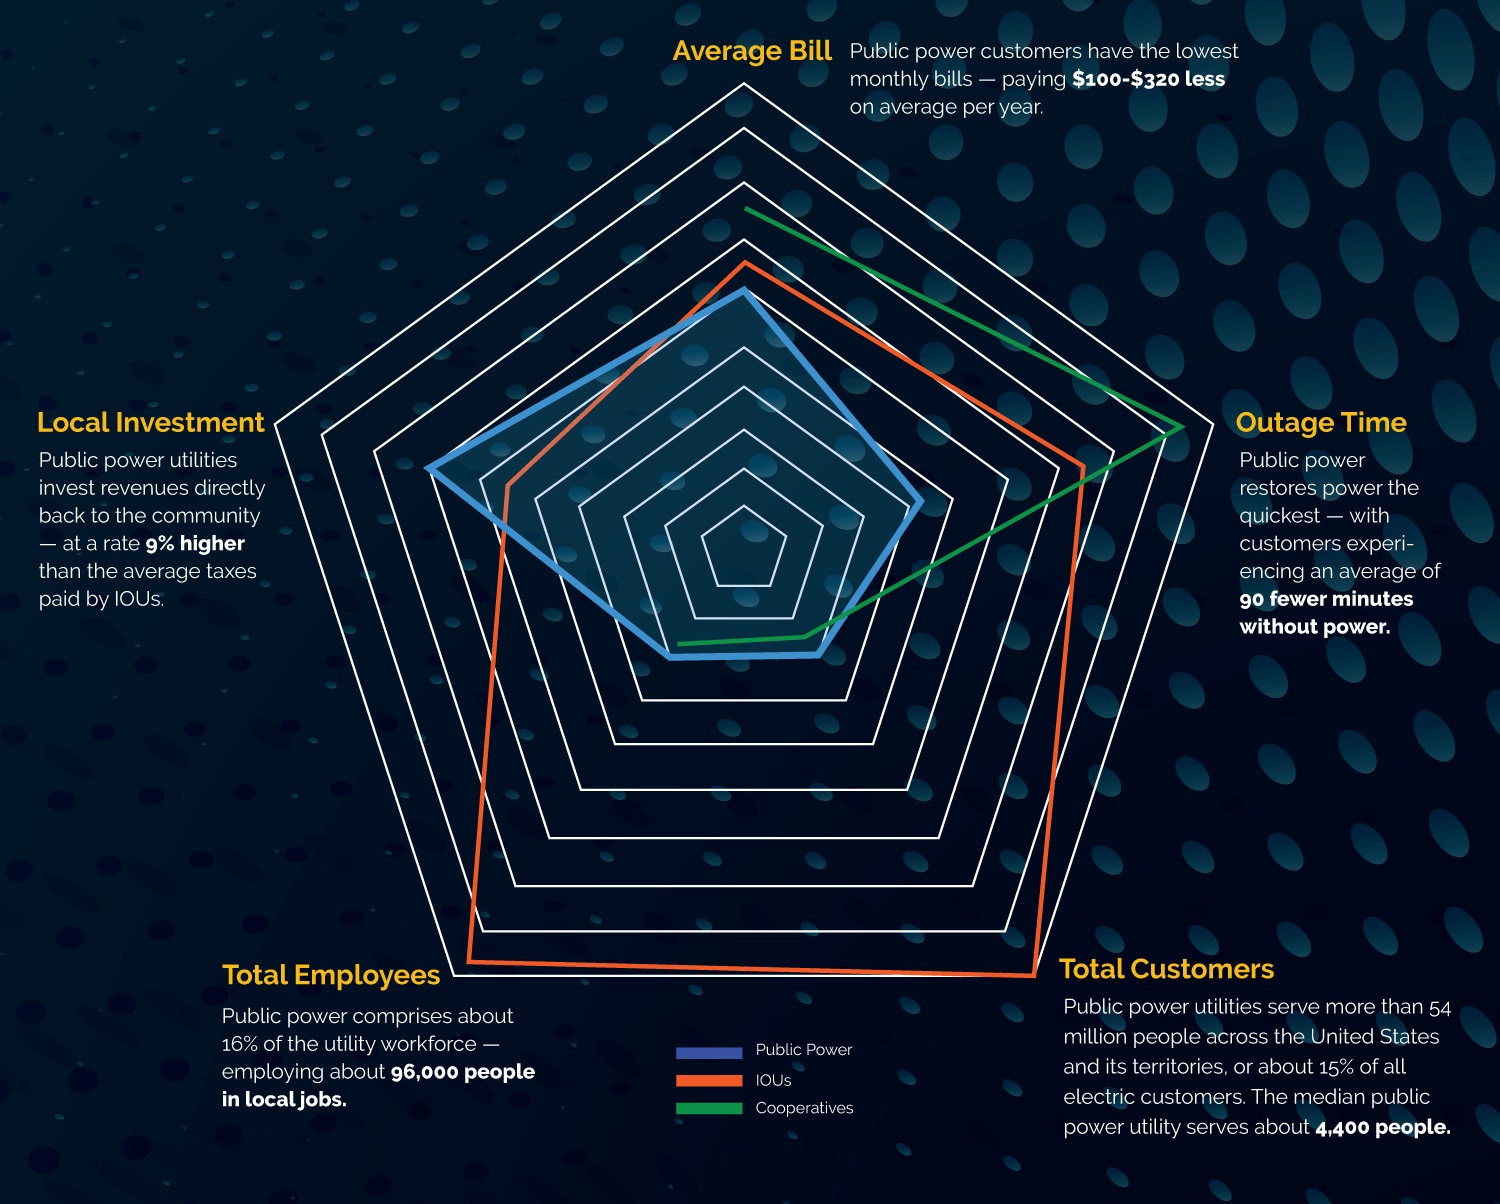
Average Bill: Public power customers have the lowest monthly bills — paying $100-$320 less on average per year.
Local Investment: Public power utilities invest revenues directly back to the community — at a rate 9% higher than the average taxes paid by IOUs.
Outage Time: Public power restores power the quickest — with customers experiencing an average of 90 fewer minutes without power.
Total Customers: Public power utilities serve more than 54 million people across the United States and its territories, or about 15% of all electric customers. The median public power utility serves about 4,400 people.
Total Employees: Public power comprises about 16% of the utility workforce — employing about 96,000 people in local jobs.

Sources: Energy Information Administration Form EIA-861, 2022; 2024 Public Power Statistical Report; Center for Energy Workforce Development; Public Power Pays Back, 2022
