
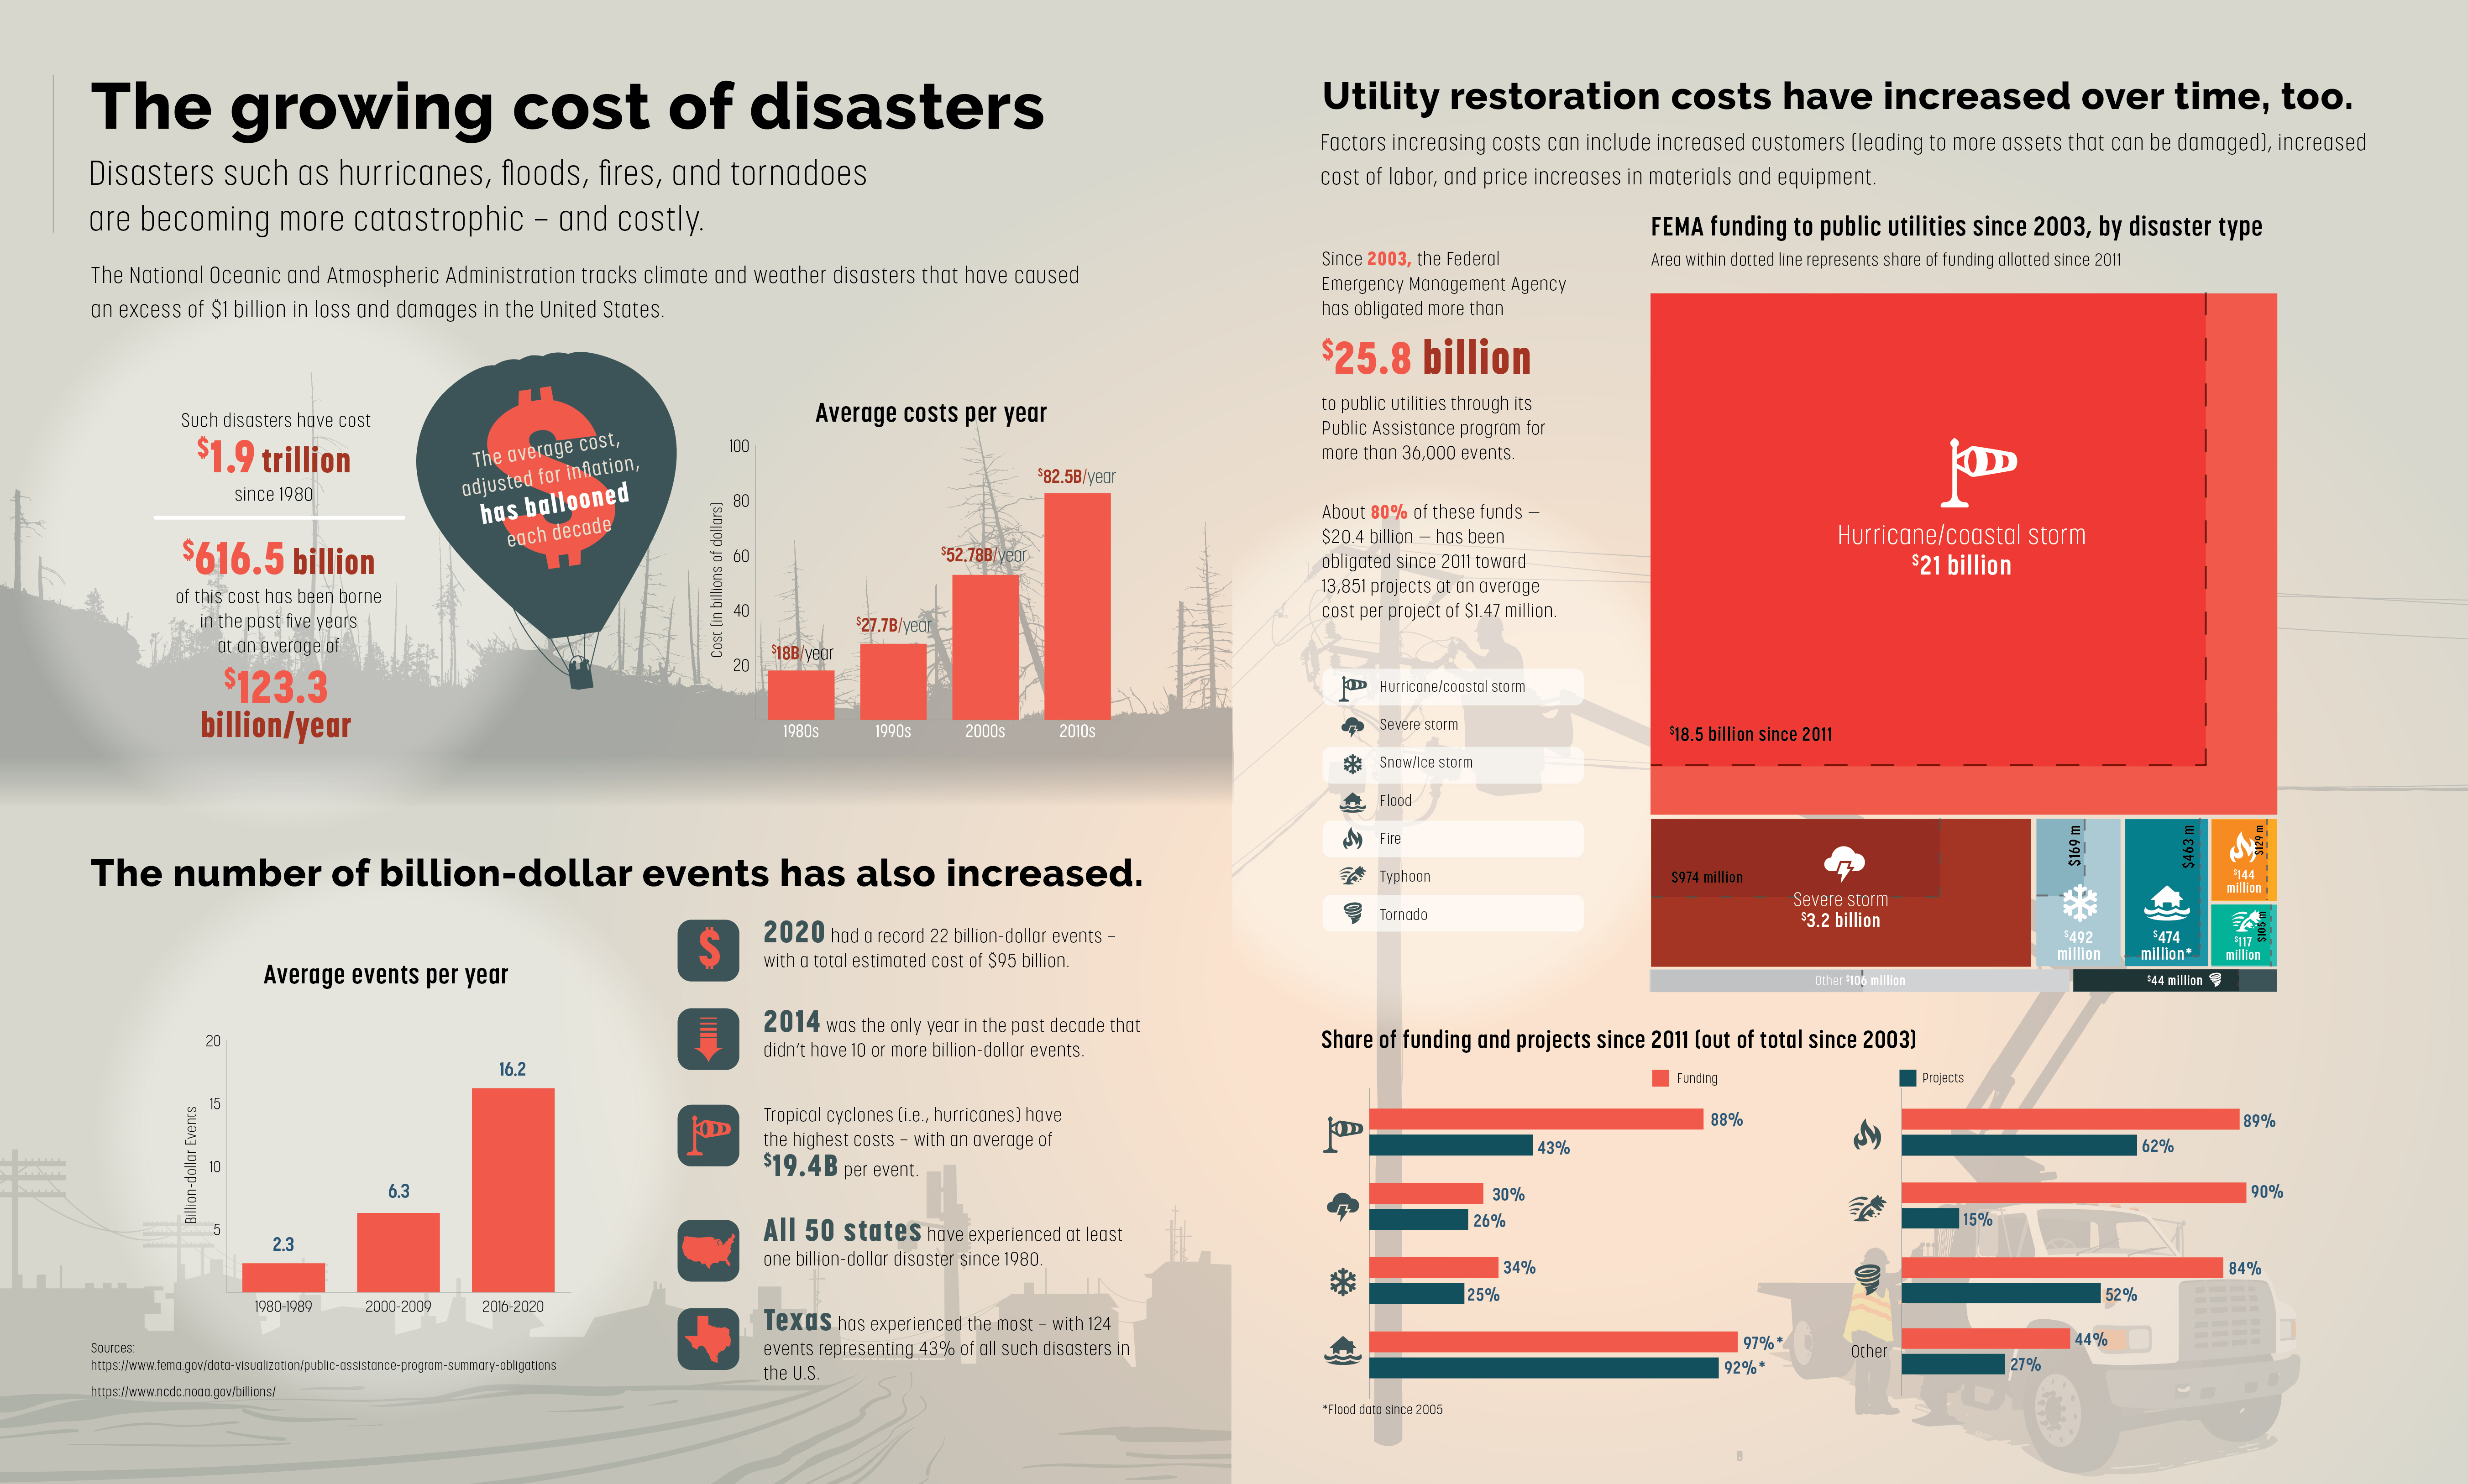
Disasters such as hurricanes, floods, fires, and tornadoes are becoming more catastrophic – and costly.
The National Oceanic and Atmospheric Administration tracks climate and weather disasters that have caused an excess of $1 billion in loss and damages in the United States.
Such disasters have cost $1.9 trillion since 1980.
$616.5 billion of this cost has been borne in the past five years at an average of $123.3 billion/year.
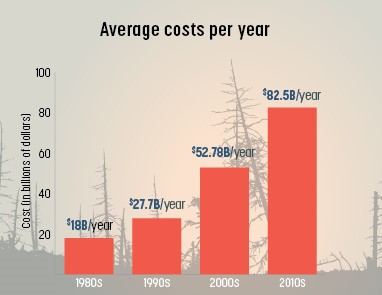
The average cost, adjusted for inflation, has ballooned each decade.
| 1980s: $18B/year | 1990s: $27.7B/year | 2000s: $52.78B/year | 2010s: $82.5B/year |
The number of billion-dollar events has also increased.
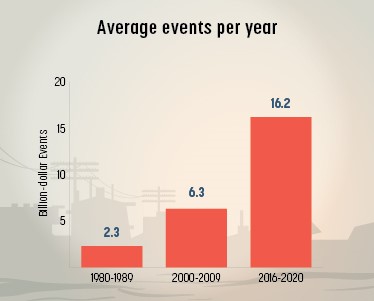
2020 had a record 22 billion-dollar events – with a total estimated cost of $95 billion.
2014 was the only year in the past decade that didn’t have 10 or more $1 billion events.
Tropical cyclones (i.e., hurricanes) have the highest costs – with an average of $19.4B per event.
All 50 states have experienced at least one billion-dollar disaster since 1980.
Texas has experienced the most – with 124 events representing 43% of all such disasters in the U.S.
Utility restoration costs have increased over time, too
Factors increasing costs can include increased customers (leading to more assets that can be damaged), increased cost of labor, and price increases in materials and equipment.
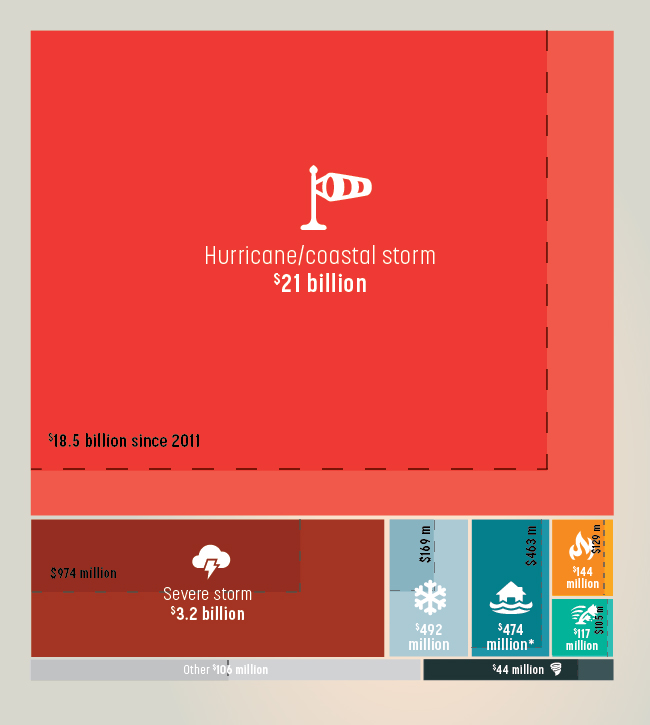
Since 2003, the Federal Emergency Management Agency has obligated more than $25.8 billion to public utilities through its Public Assistance program for more than 36,000 events.
About 80% of these funds - $20.4 billion - has been obligated since 2011 toward 13,851 projects at an average cost per project of $1.47 million.
FEMA funding to public utilities since 2003, by disaster type
(Area in dotted line represents share of funding allotted since 2011)
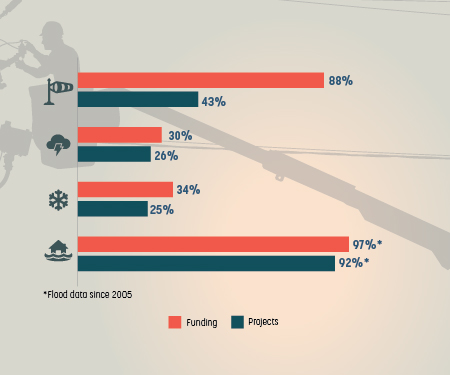
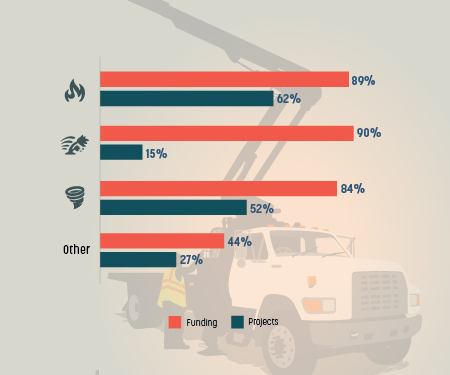
Share of funding and projects since 2011 (out of total since 2003)
 |
 |