Looking for research and development projects made possible through DEED grants and scholarships? Check out the DEED Project Database.
Trying to find information about specific public power utilities? If you are member, check out the Public Power Directory.
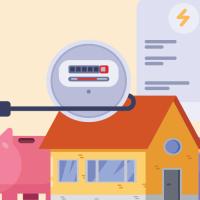
A simple explanation of the average breakdown of costs to generate and deliver electricity to customers on the grid, and what costs utilities incur to keep the power flowing.
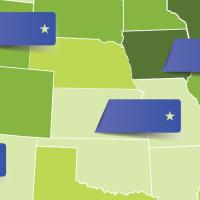
A state-by-state look at the average monthly bill for public power customers, and in which states public power customers enjoy the deepest savings.
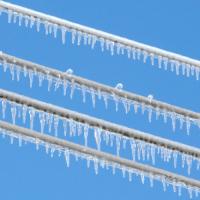
A summary about what went right, what went wrong, and what needs to change in the electric sector following Winter Storm Uri based on what we know from hearings at...
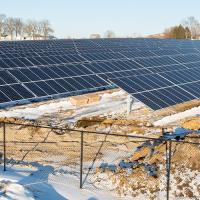
Belmont Light in Massachusetts has developed an energy resource planning model with the help of a Demonstration of Energy & Efficiency Developments (DEED) grant from the American Public Power Association.
The Public Power Statistical Report is the central source for American Public Power Association members to find data that detail key aspects of public power and the electric utility industry...
March 31, 2026