
At the end of 2025, there were 8,867 megawatts of generating capacity in some stage of development attributed to public power entities – a 7% increase over the capacity in development at the end of 2024.
Most of the projects are for natural gas capacity (55%), including 37% of the capacity either under construction or permitted.
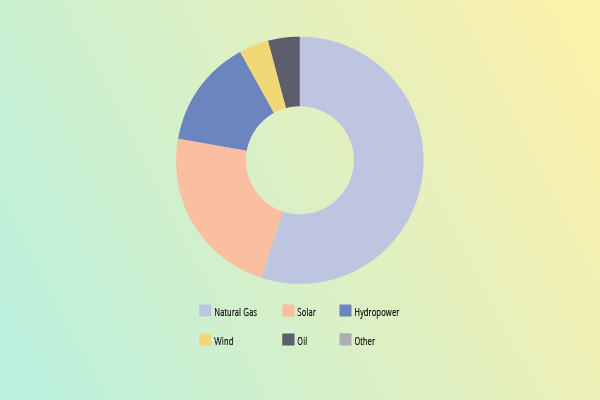
The capacity total doesn’t include storage assets under development, of which there are about 20 projects across the U.S.
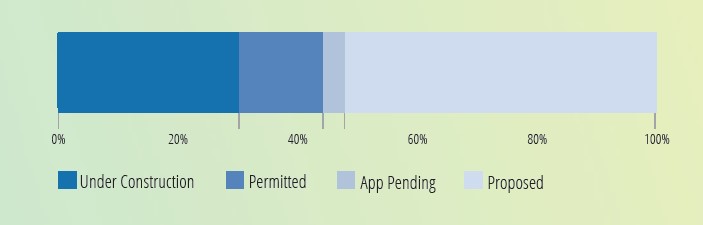
Most capacity is still in the early stages of development (4,945 MW). Nearly 88% of solar capacity under development is in the “proposed” stage.
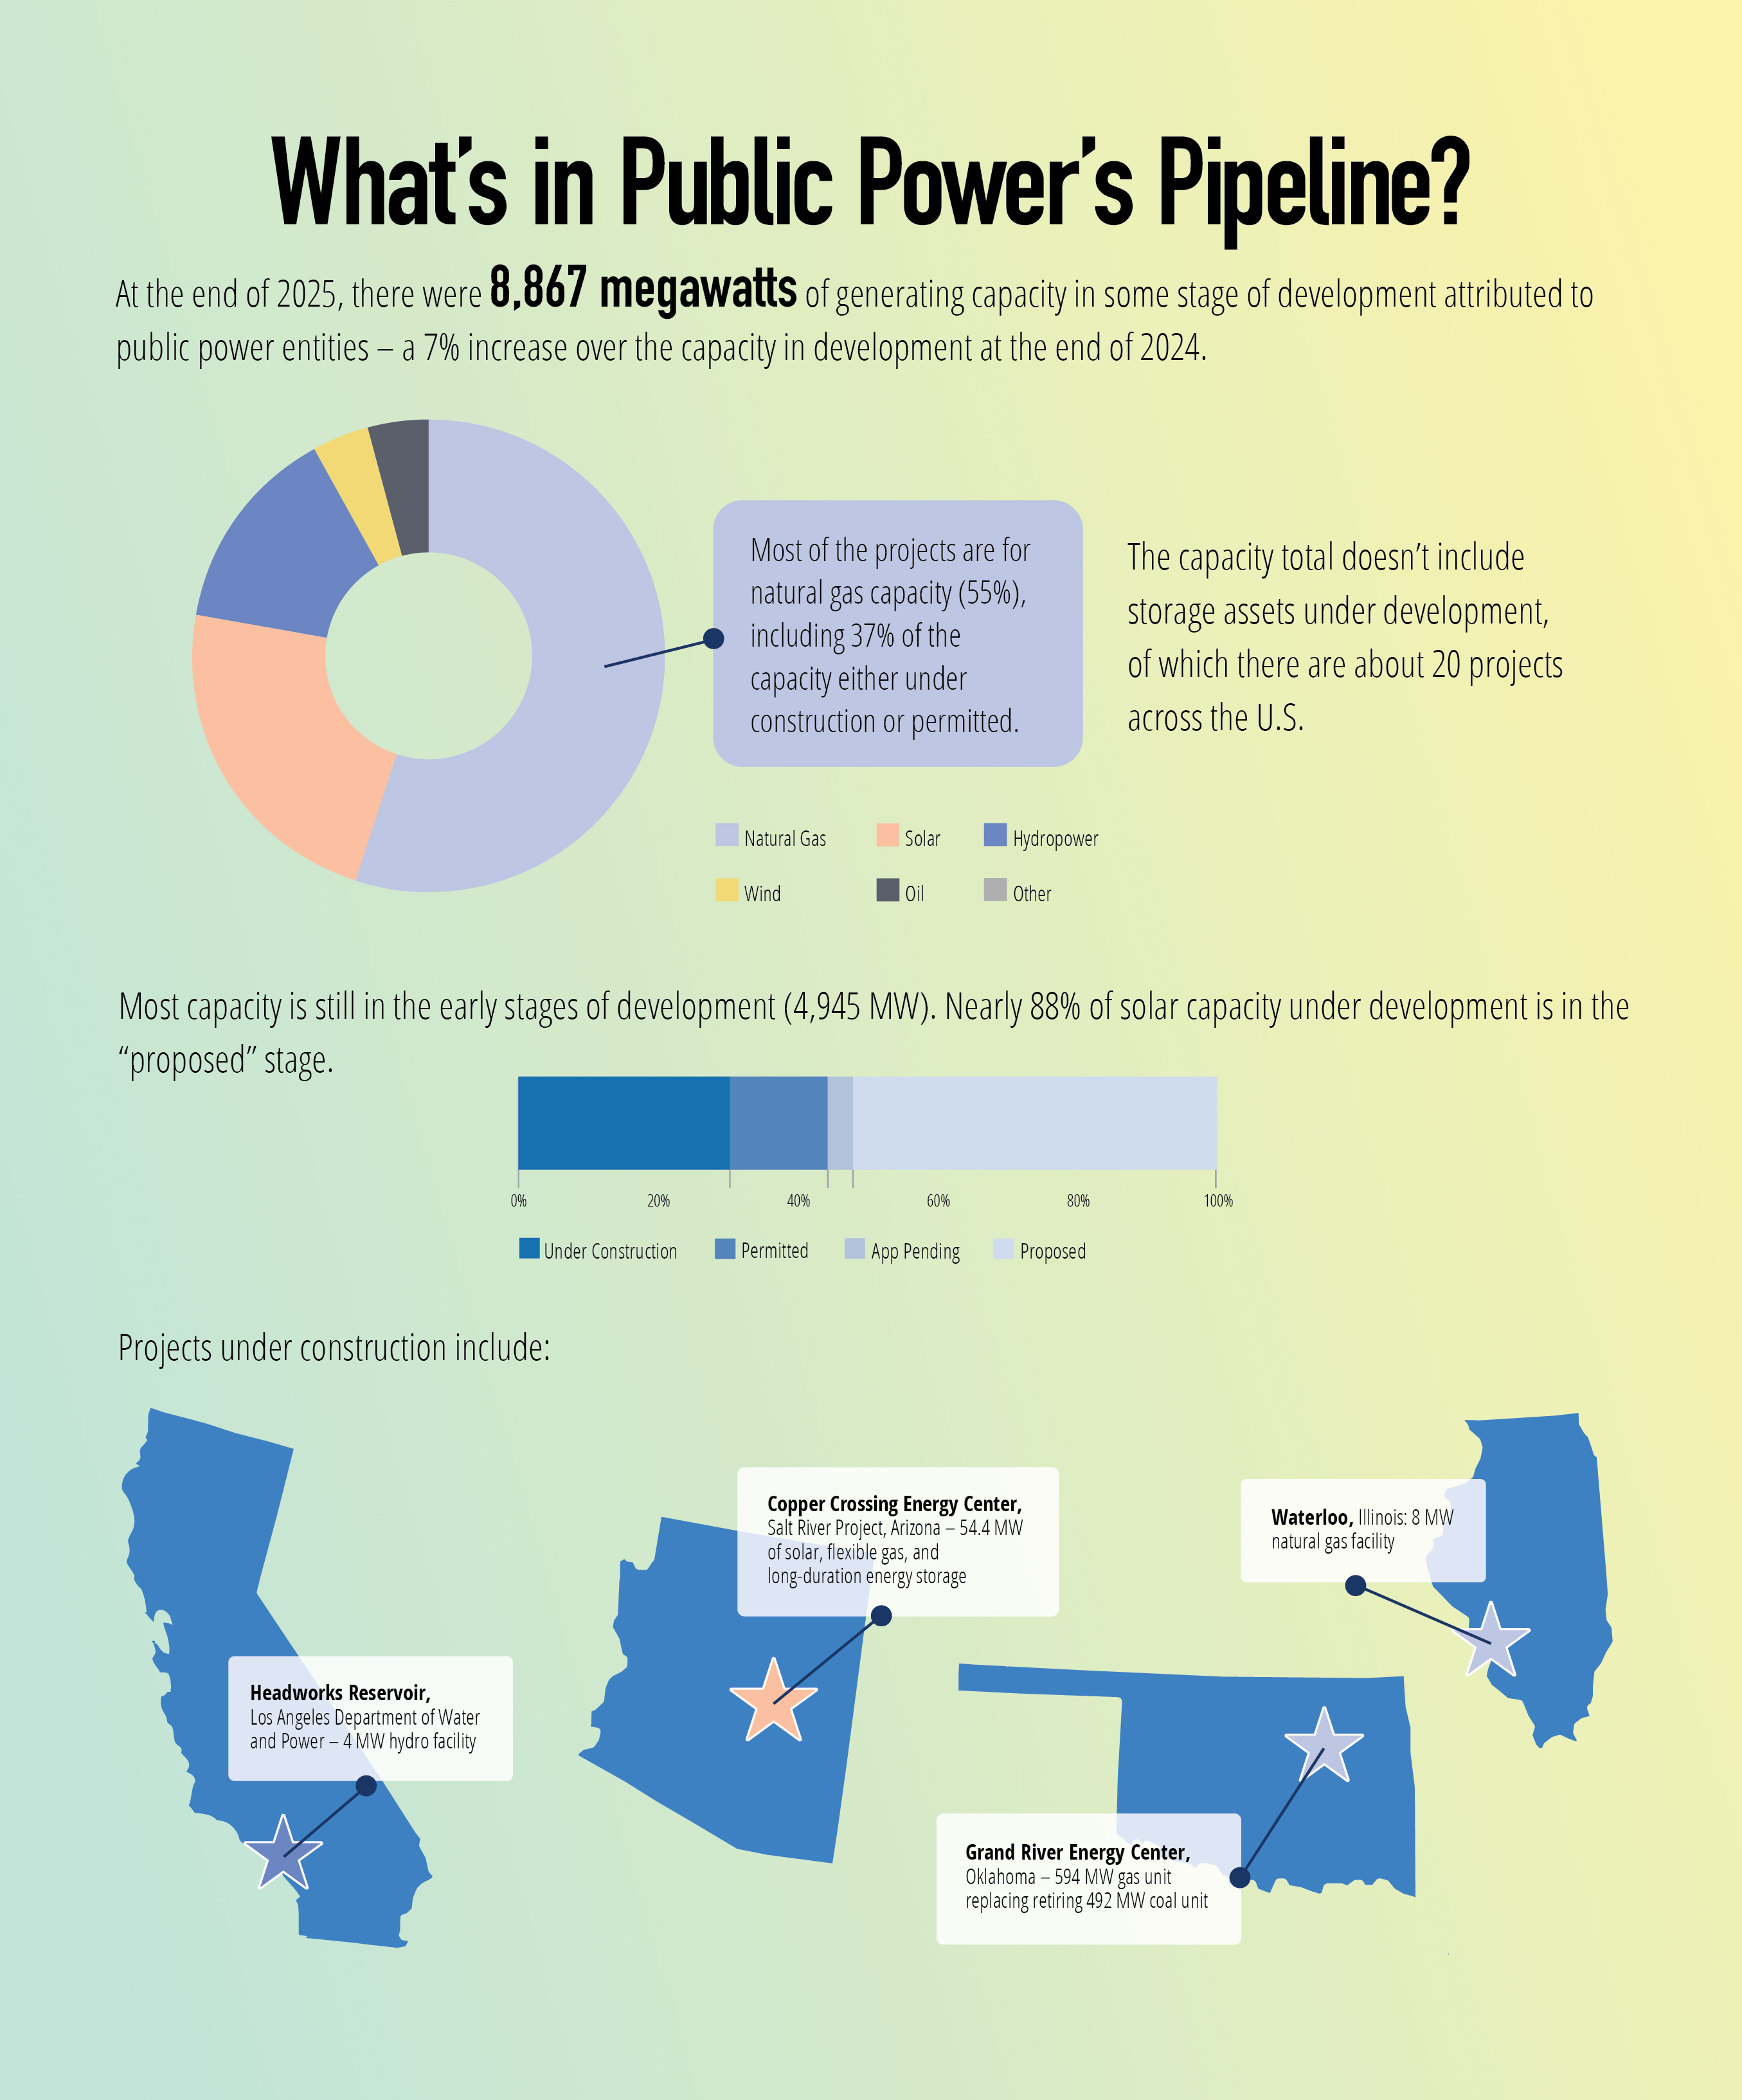
Projects under construction include:
 | Headworks Reservoir, Los Angeles Department of Water and Power – 4 MW hydro facility |
 | Copper Crossing Energy Center, Salt River Project, Arizona – 54.4 MW of solar, flexible gas, and long-duration energy storage |
 | Grand River Energy Center, Oklahoma – 594 MW gas unit replacing retiring 492 MW coal unit |
 | Waterloo, Illinois: 8 MW natural gas facility |