
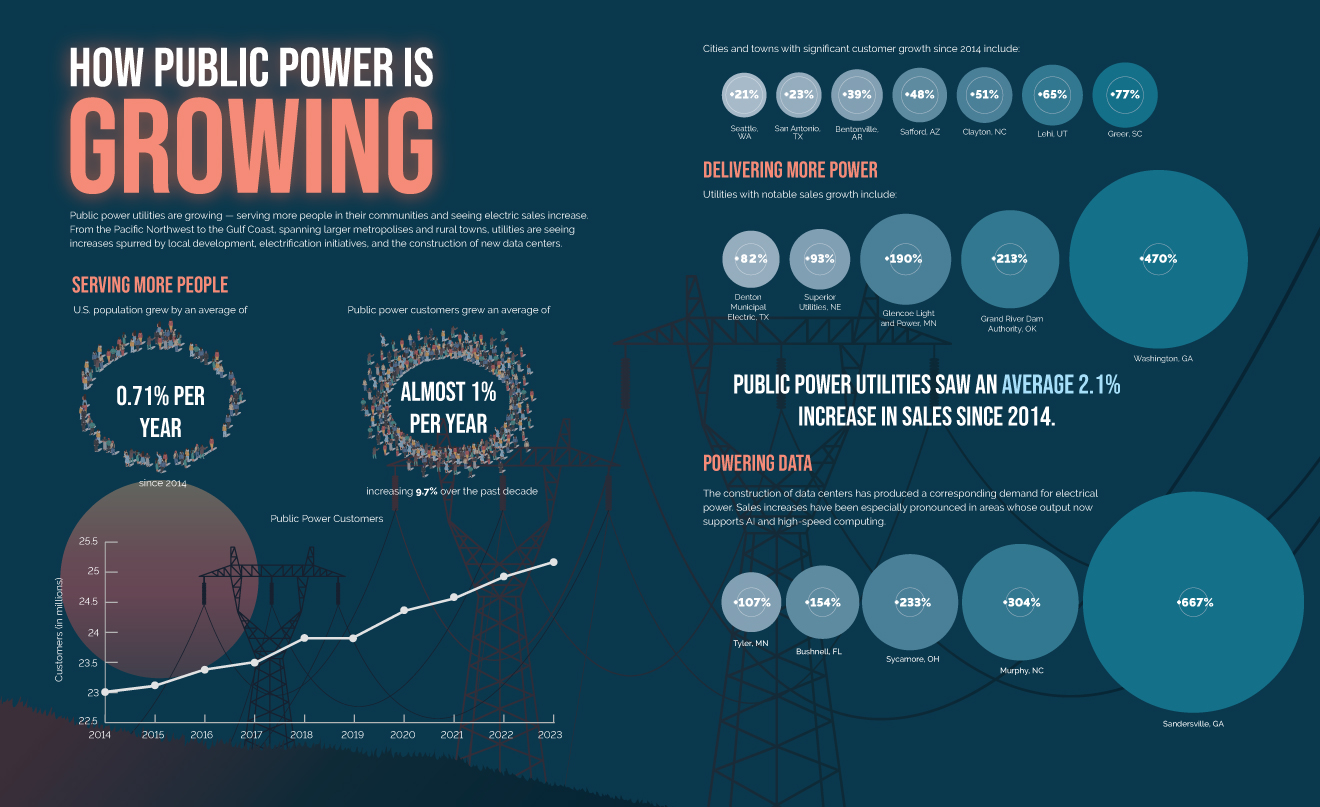
Public power utilities are growing — serving more people in their communities and seeing electric sales increase. From the Pacific Northwest to the Gulf Coast, spanning larger metropolises and rural towns, utilities are seeing increases spurred by local development, electrification initiatives, and the construction of new data centers.
Serving More People
While the U.S. population grew by an average of 0.71% per year, public power customers grew by an average of almost 1% per year — increasing 9.7% over the past decade.
| Average annual U.S. population growth | Public power customer average annual growth |
 |
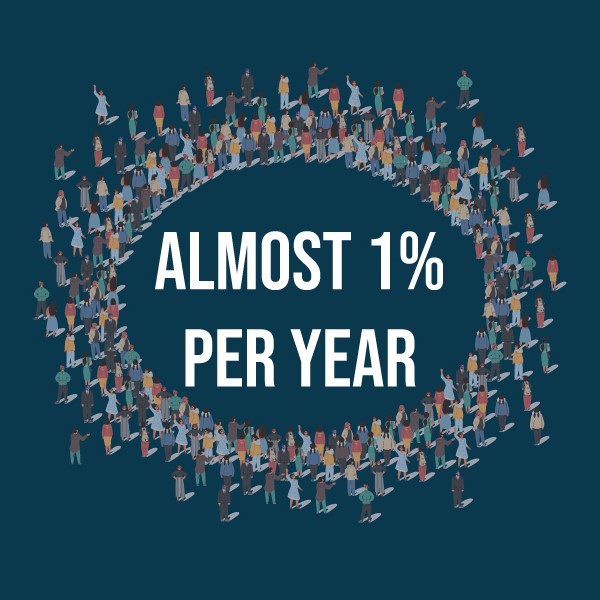 |
| since 2014 | increasing 9.7% over the past decade |
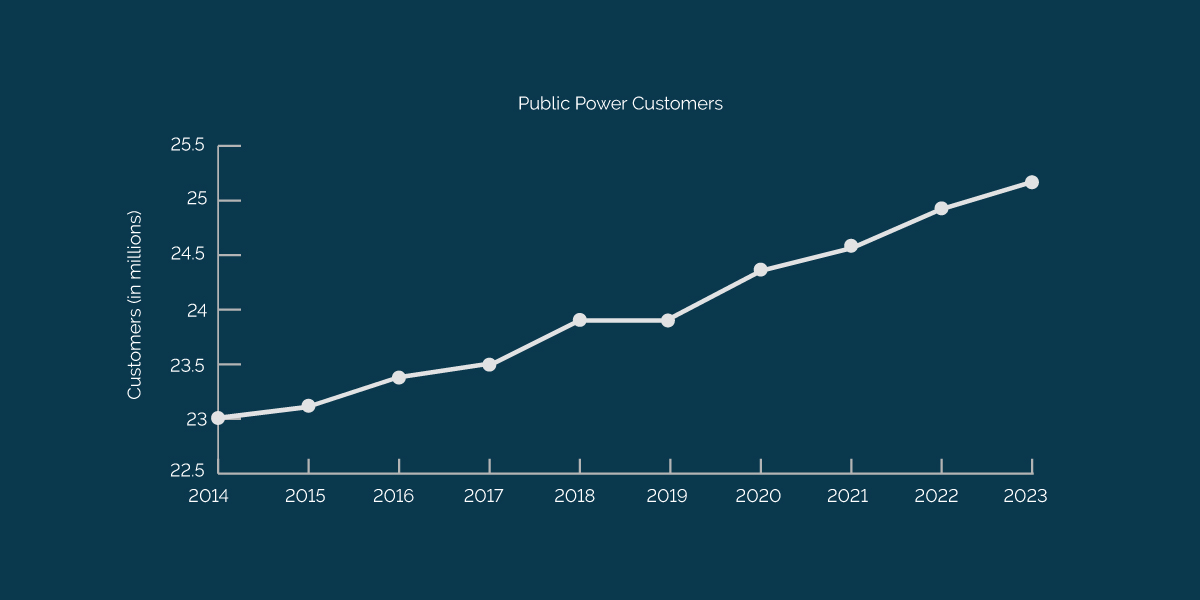
| Year | Total Public Power Customers (in millions) |
| 2014 | 22.96 |
| 2015 | 23.13 |
| 2016 | 23.34 |
| 2017 | 23.56 |
| 2018 | 23.82 |
| 2019 | 23.81 |
| 2020 | 24.33 |
| 2021 | 24.62 |
| 2022 | 24.91 |
| 2023 | 25.20 |
Cities and towns with significant customer growth since 2014 include:
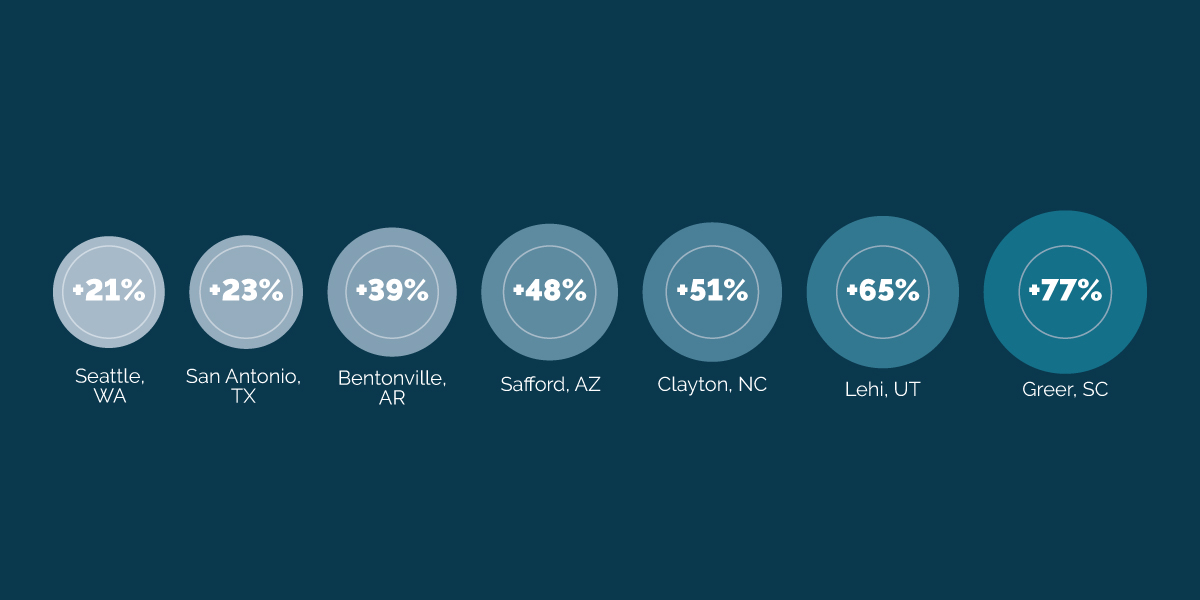
| City | Growth in Customers |
| Seattle, WA | +21% |
| San Antonio, TX | +23% |
| Bentonville, AR | +39% |
| Safford, AZ | +48% |
| Clayton, NC | +51% |
| Lehi, UT | +65% |
| Greer, SC | +77% |
Delivering More Power
Public power utilities saw an average 2.1% increase in sales since 2014.
Utilities with notable sales growth include:
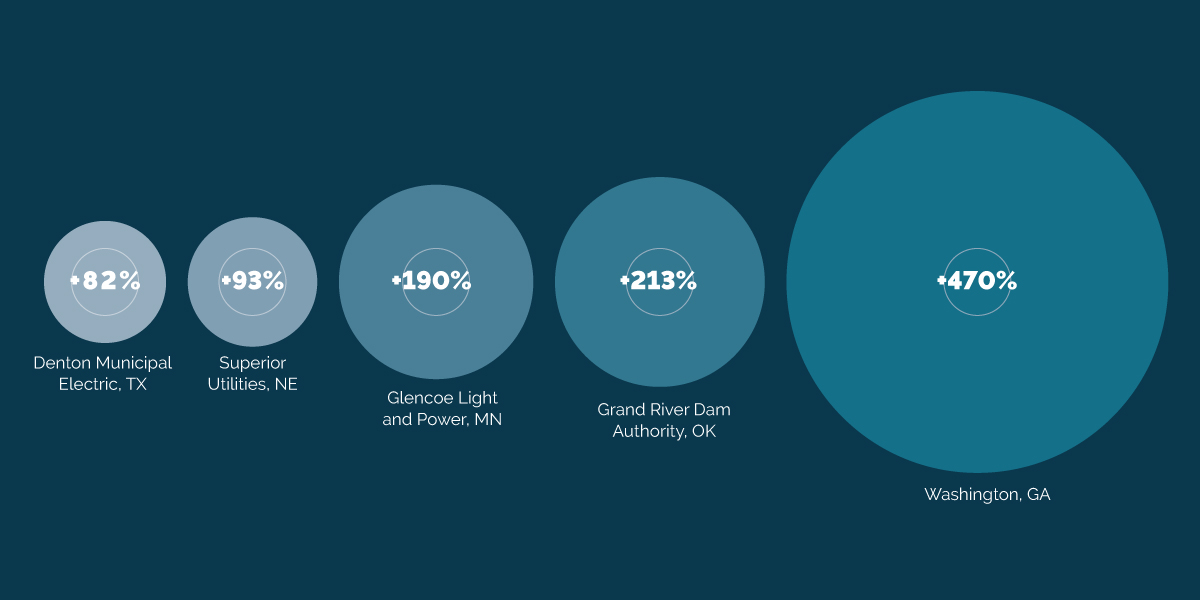
| Utility | Growth in Sales |
| Denton Municipal Electric, TX | +82% |
| Superior Utilities, NE | +93% |
| Glencoe Light and Power, MN | +190% |
| Grand River Dam Authority, OK | +213% |
| Washington, GA | +470% |
Powering Data
The construction of data centers has produced a corresponding demand for electrical power. Sales increases have been especially pronounced in areas whose output now supports AI and high-speed computing.
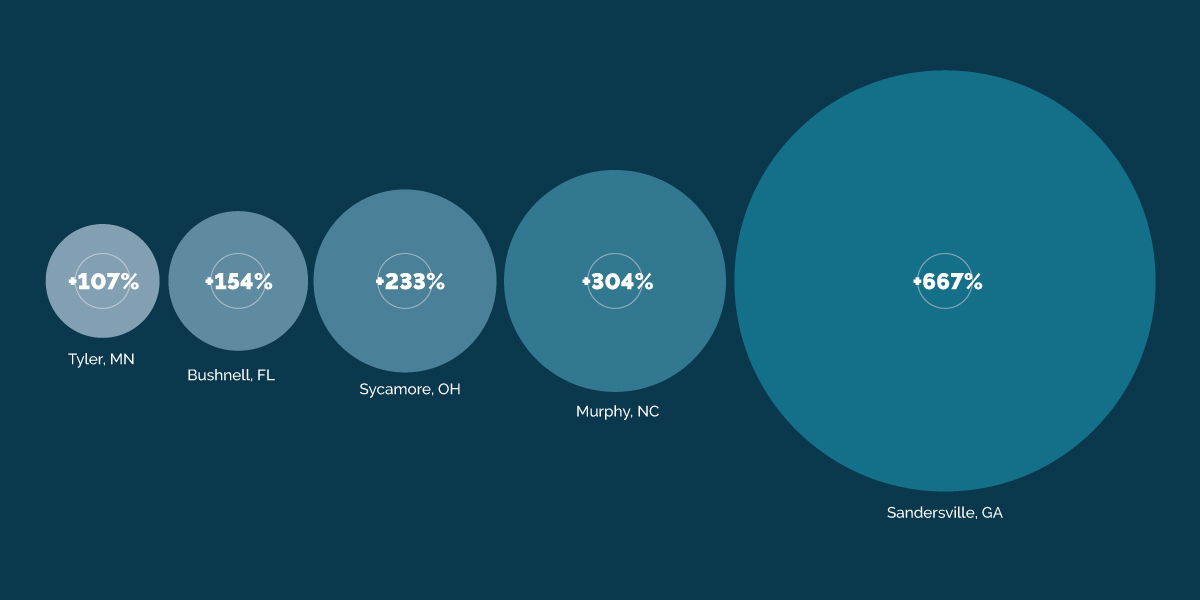
| City | Growth in Sales |
| Tyler, MN | +107% |
| Bushnell, FL | +154% |
| Sycamore, OH | +233% |
| Murphy, NC | +304% |
| Sandersville, GA | +667% |