
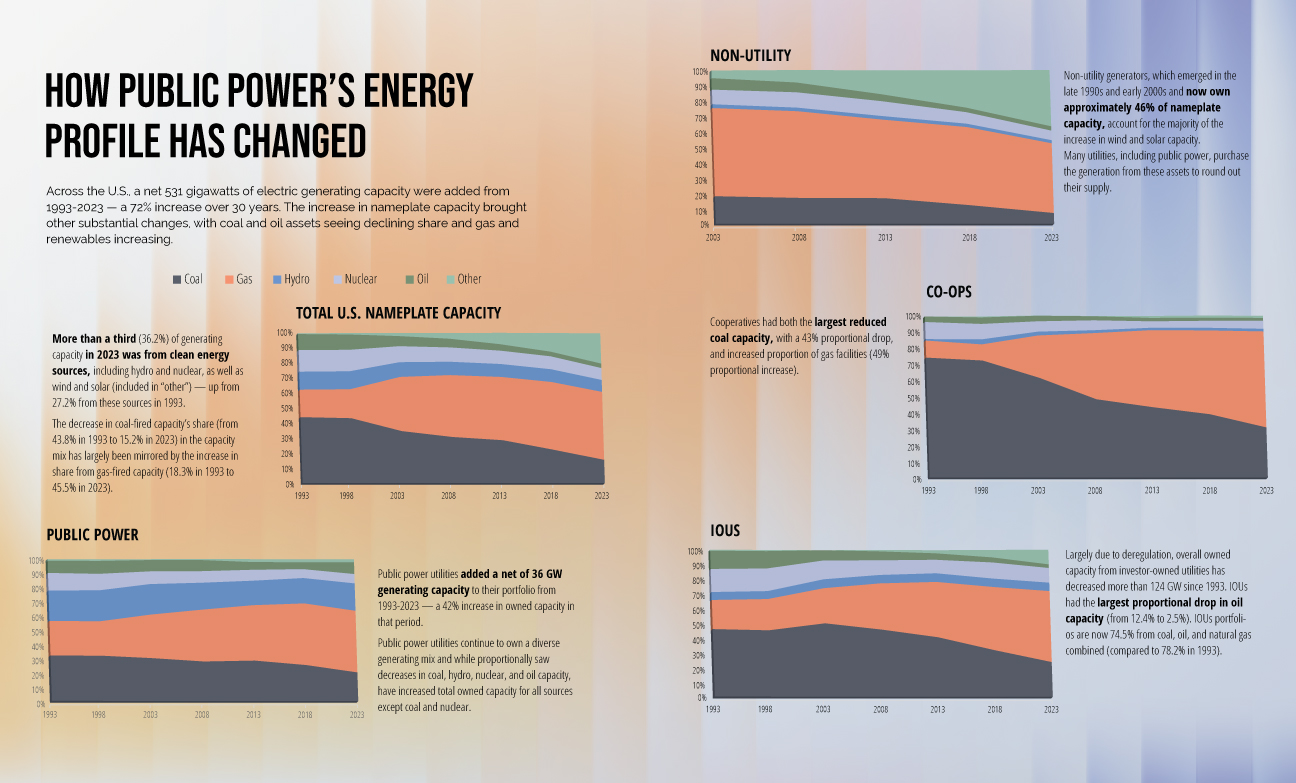
Across the U.S., a net 531 gigawatts of electric generating capacity were added from 1993-2023 — a 72% increase over 30 years. The increase in nameplate capacity brought other substantial changes, with coal and oil assets seeing declining share and gas and renewables increasing.
Total U.S. Nameplate Capacity
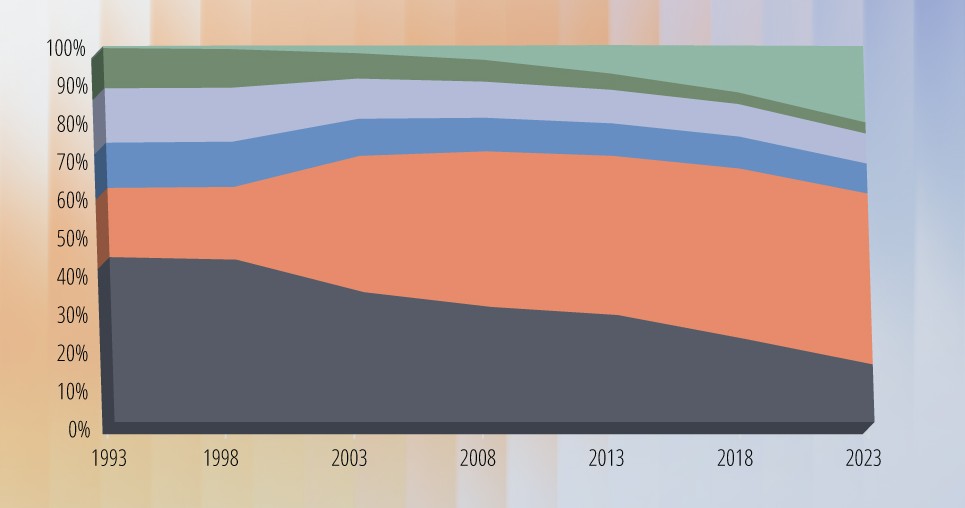 More than a third (36.2%) of generating capacity in 2023 was from clean energy sources, including hydro and nuclear, as well as wind and solar (included in “other”) — up from 27.2% from these sources in 1993. The decrease in coal-fired capacity’s share (from 43.8% in 1993 to 15.2% in 2023) in the capacity mix has largely been mirrored by the increase in share from gas-fired capacity (18.3% in 1993 to 45.5% in 2023).
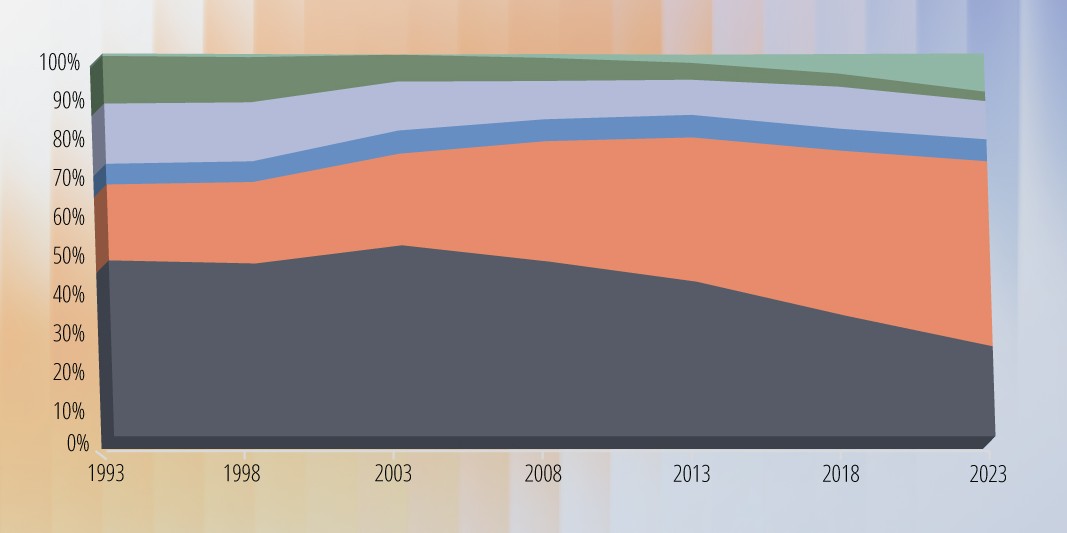
Public Power
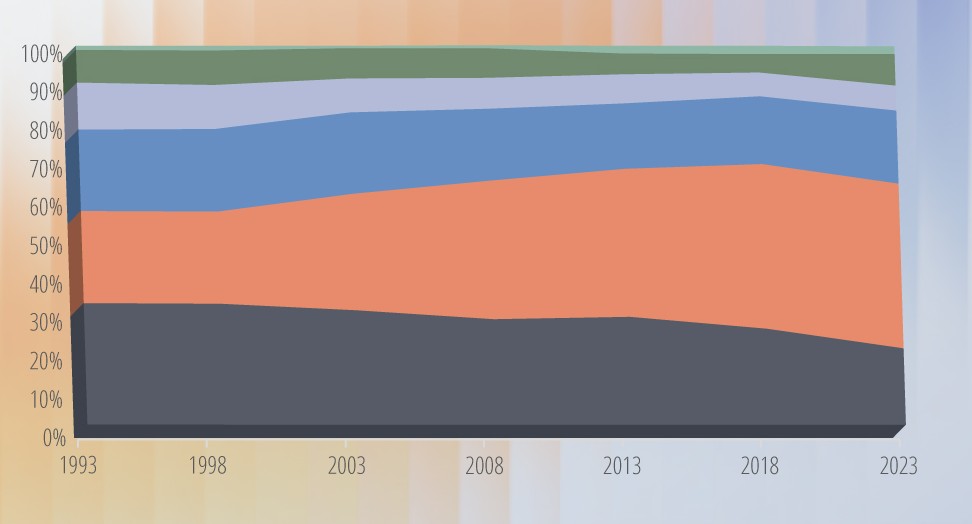 Public Power utilities added a net of 36 GW generating capacity to their portfolio from 1993-2023 — a 42% increase in owned capacity in that period. Public power utilities continue to own a diverse generating mix and while proportionally saw decreases in coal, hydro, nuclear, and oil capacity, have increased total owned capacity for all sources except coal and nuclear.
Non-Utility
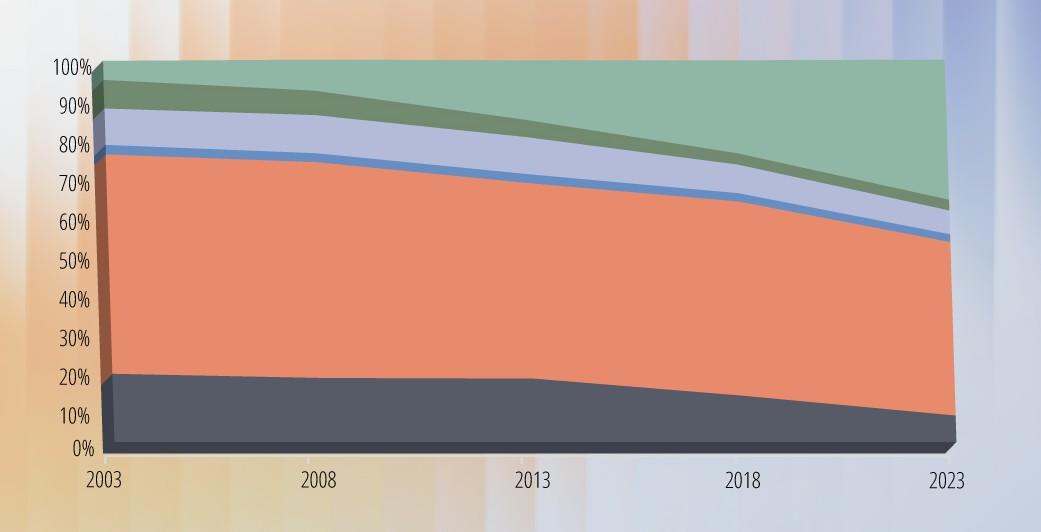 Non-utility generators, which emerged in the late 1990s and early 2000s and now own approximately 46% of nameplate capacity, account for the majority of the increase in wind and solar capacity. Many utilities, including public power, purchase the generation from these assets to round out their supply.
Co-Ops
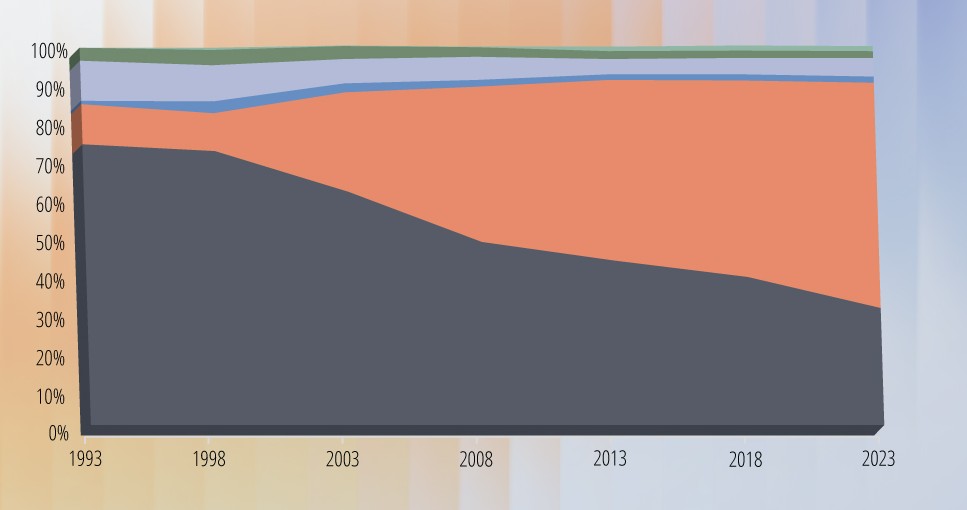 Cooperatives had both the largest reduced coal capacity, with a 43% proportional drop, and increased proportion of gas facilities (49% proportional increase).
Investor-Owned Utilities
 Largely due to deregulation, overall owned capacity from investor-owned utilities has decreased more than 124 GW since 1993. IOUs had the largest proportional drop in oil capacity (from 12.4% to 2.5%). IOUs portfolios are now 74.5% from coal, oil, and natural gas combined (compared to 78.2% in 1993).