
By Kevin Bleau, energy resources manager, Belmont Light, Massachusetts; Doron Koll, Stan Faryniarz, and Crissy Maddalo, Daymark Energy Advisors. Supported and made possible by Craig Spinale, Belmont Light's general manager.
Acknowledgements
Belmont Light has been powering the Belmont community since 1898. We are the municipal light plant serving over 11,000 residential, commercial, and municipal customers in the town of Belmont, MA.
Daymark Energy Advisors brings deep knowledge and an integrated view of energy infrastructure, regulation, and markets to help our clients succeed in the face of uncertainty and transformative change. Our advice is backed by the highest quality analytics. We advise clients across the U.S. and Canada assessing opportunities and risks in RTOs/ISOs and regulated markets. We combine rigorous analytical methodology with our knowledge of RTO/ISO operations and market rules, transmission planning, state and federal policies, and regulatory and rate structures, to provide comprehensive solutions that address client needs.
| Belmont Light | Belmont, MA |
| Customers | 11,800+ |
| Annual Retail Load | 130,000 MWh |
| Annual Peak | 34 MW |
| Generation Portfolio | 61% general grid mix (emissions offset by purchase of Renewable Energy Certificates) 21% hydro 13% wind 5% solar |
| Governance | Five member municipal town-elected board |
| Key Results | TOU pilot customers showed 15% lower average peak load during summer peaks TOU customers with solar and storage showed pronounced load shifting |
Background
Belmont Light serves a primarily residential town of more than 28,000 people just west of Boston, Massachusetts. The town has owned and operated the municipal utility since 1898. Belmont Light has kept a 100 percent non-emitting power supply portfolio since 2022, is designated as a Smart Energy Provider by APPA, and is EVAL Gold Certified by Forth for providing access to electric vehicle charging. It effectively deployed advanced metering infrastructure in 2016.
In 2024, Belmont Light commissioned Daymark Energy Advisors to conduct a load research study to examine the extent to which its residential time-of-use rate pilot program was shifting load away from peak periods, as well as whether its electrification incentives (promoting distributed solar, battery energy storage, EV charging, and heat pumps) were helping to lower system costs and its overall emissions footprint. Belmont Light also wanted to study whether these programs could lower electricity bills for various customer classes that adopted TOU and electrification measures.
Load Research Background
Belmont Light’s goal in conducting a comprehensive load research study was to develop a robust understanding of customer load patterns and support an updated allocated cost-of-service study and future rate design. Daymark Energy Advisors, a consulting firm with extensive experience helping public power utilities with rate design efforts, procurements, and energy management, was prepared to help achieve this goal.
The first step in the process of assessing and designing Belmont Light’s rates was the load research study. The results informed Belmont Light on its daily, seasonal, and annual load patterns, along with coincident and n noncoincident peak demands. The scope of the study included an examination of Belmont Light’s full system load, including load patterns among its different customer rate classes. The study suggested modifications, additions, and consolidations to each customer class based solely on the load profile. This activity was a key, but not the only use of Belmont’s load research.
At request from Craig Spinale, Belmont Light’s general manager, Daymark then undertook a complete review of Belmont Light’s existing rate design, including the residential TOU pilot. The load research study inspired Belmont Light to consider several important concepts: (1) the efficacy of the TOU rate design, (2) the effectiveness of current electrification incentives and ideas for future incentives, (3) where and how rate designs could be improved, and (4) whether Belmont Light would benefit from a new allocated cost of service study to consider additional rate design initiatives (e.g., setting up a commercial or municipal TOU rate).
Methodology
The load research study relied on granular hourly data from AMI deployed across Belmont Light’s full customer base, assessing the 2022 and 2023 calendar years. Customer meters were segmented by Belmont Light’s four major classes: Residential Rate A, Residential Non-Rate A (with further examination of the Emissions Free Rate (EFR) for solar and battery customers, TOU, and Low-Income (LI) subgroups), Commercial, and Municipal customers. In addition to basic consumption data, Belmont Light used its incentive database to identify customers who own distributed energy technologies, such as rooftop solar photovoltaic systems (PV), battery energy storage systems (BESS), EVs, or air-source heat pumps (ASHPs). These subgroups could then be studied separately.
The study analyzed this data by constructing hourly average load shapes, seasonal usage profiles, weekday versus weekend demand comparisons, and monthly system peaks. It also calculated class-specific load factors based on non-coincident peaks and coincident peaks to assess the relationship between customers’ average consumption and their peak demands. Notably, the study chose not to weather-normalize the data; instead, it preserved actual usage patterns to better capture customer responses to real-world weather events, such as heatwaves and arctic blasts, which significantly influenced system peaks during both 2022 and 2023.
A particular focus was placed on evaluating the behavior of Non-Rate A customers, especially those participating in Belmont Light’s voluntary residential TOU rate program. For context, we include a brief description of Belmont Light’s TOU initiative below.
TOU History
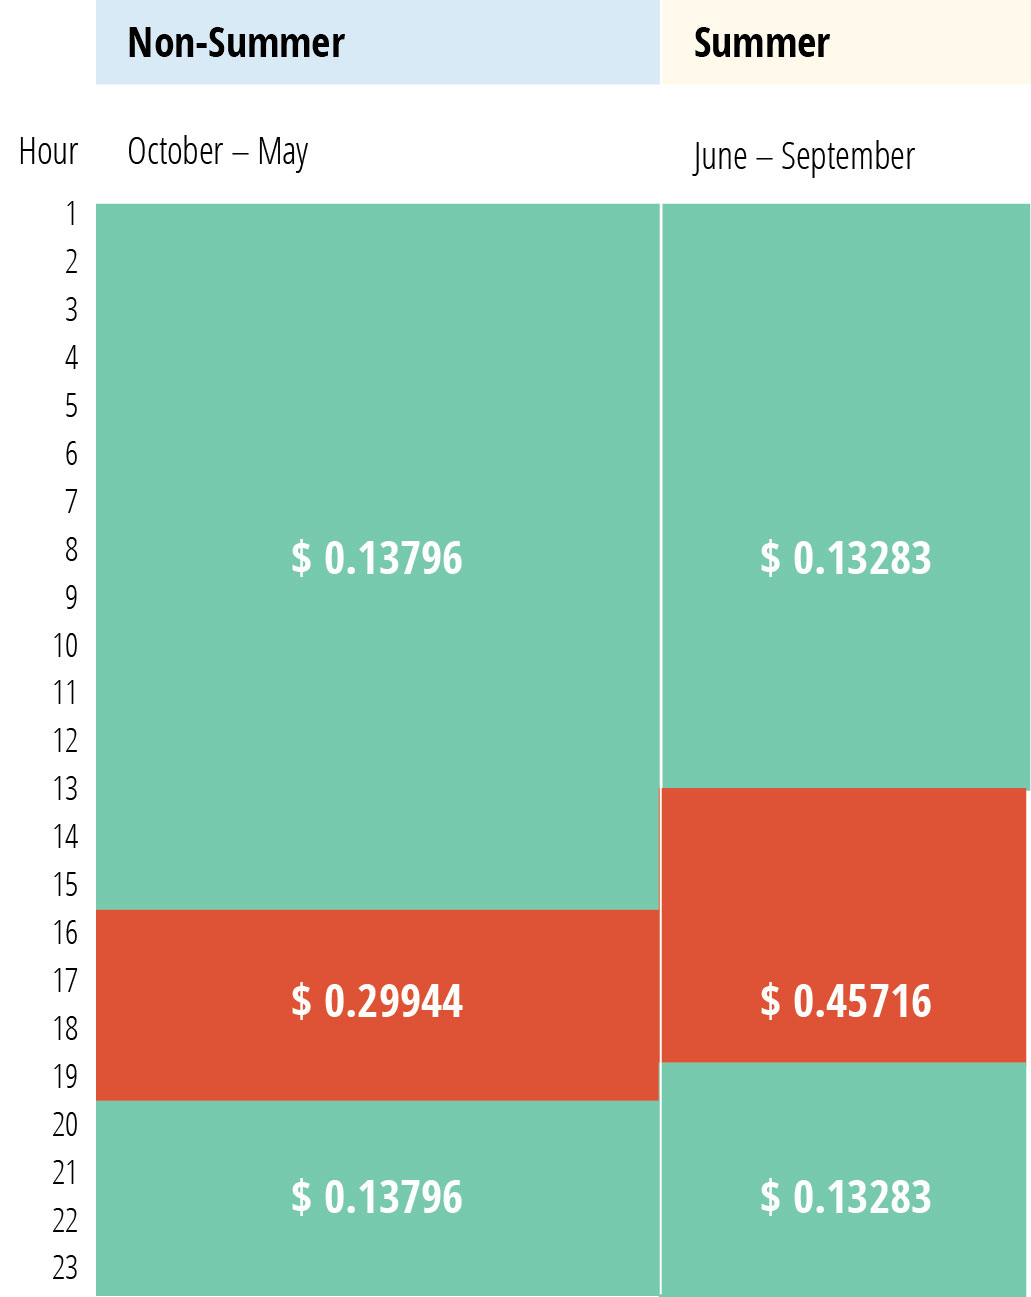
In 2021, the Belmont Light Board endorsed the creation of a pilot residential TOU rate, where customers pay more for electricity during certain on-peak afternoon/evening hours and less during the remaining off-peak hours. During the 2022–2023 study period, Belmont Light’s peak to off-peak period prices were significantly levered — by almost 3.5:1 in summer months and almost 2.2:1 in non-summer months.
By sending these strong price signals, Belmont Light hoped to save on transmission and capacity costs and lessen dependence on fossil fuel generation by shifting load away from peak hours. See Figure 1.
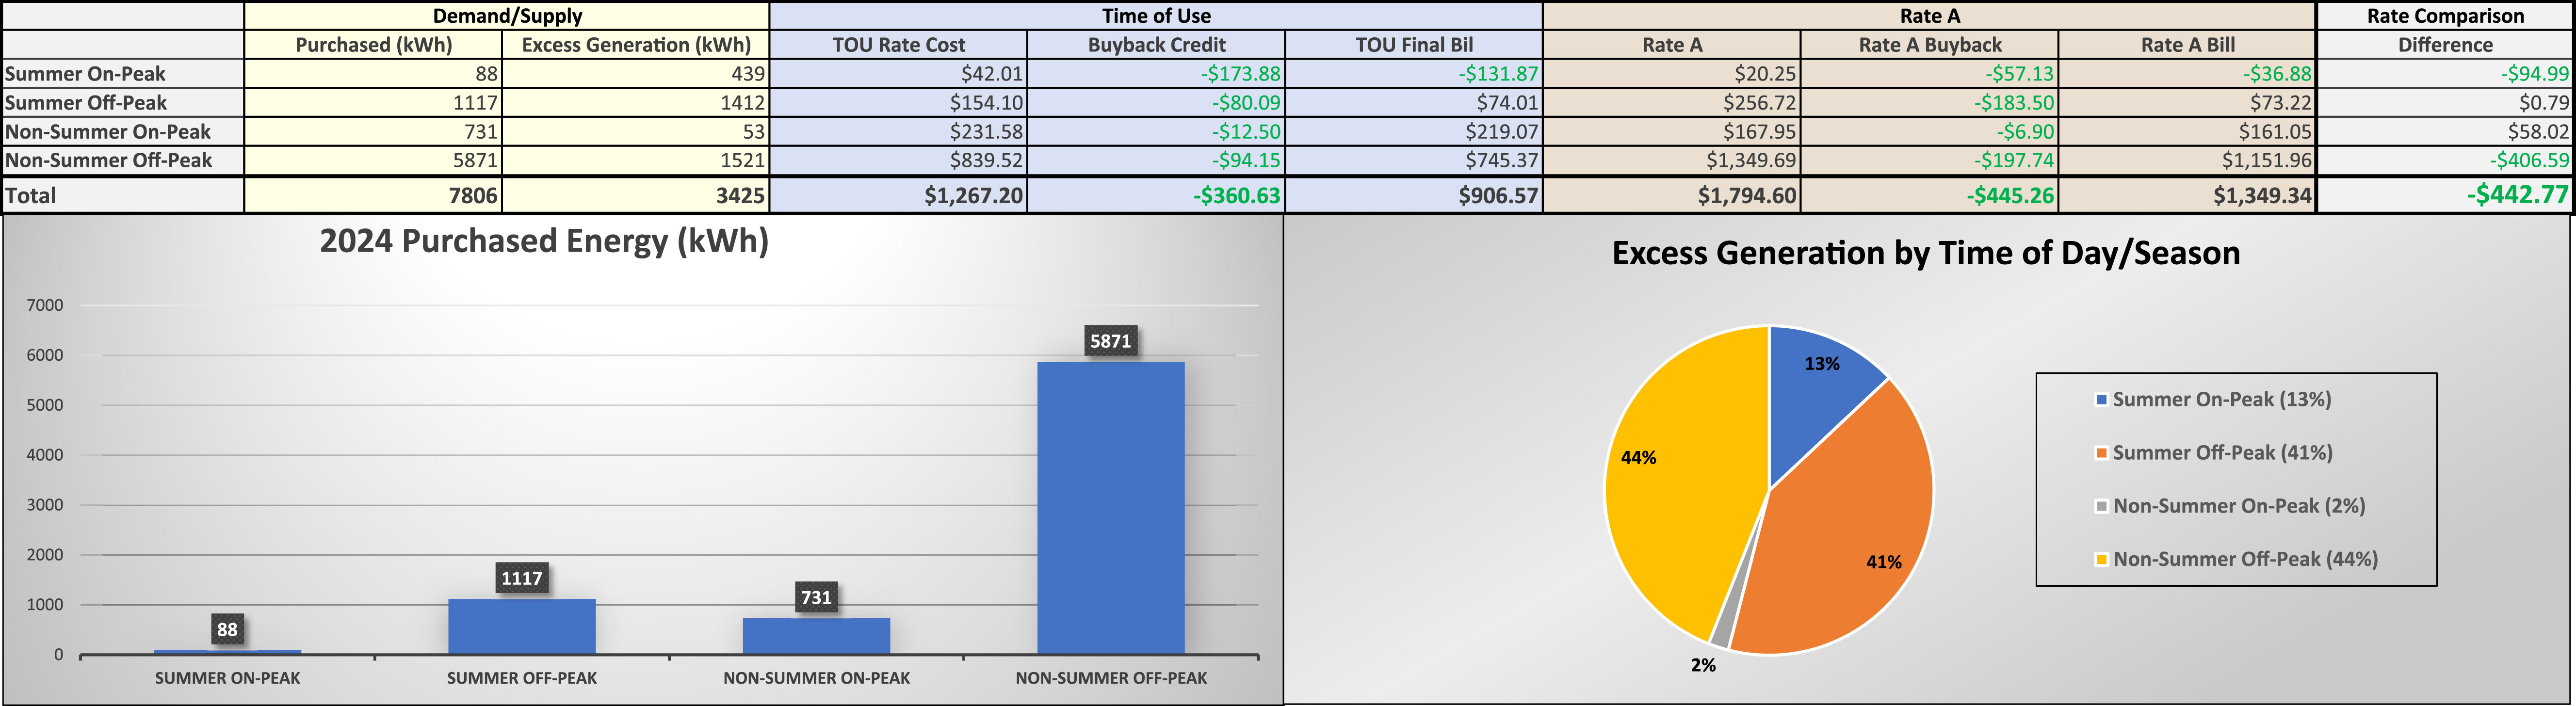
Staff prepared a calculator so residential customers could compare their costs of the standard Rate A versus the pilot TOU rate. The solar customer in Figure 2 would save $442.77 annually on the TOU rate compared with Rate A.
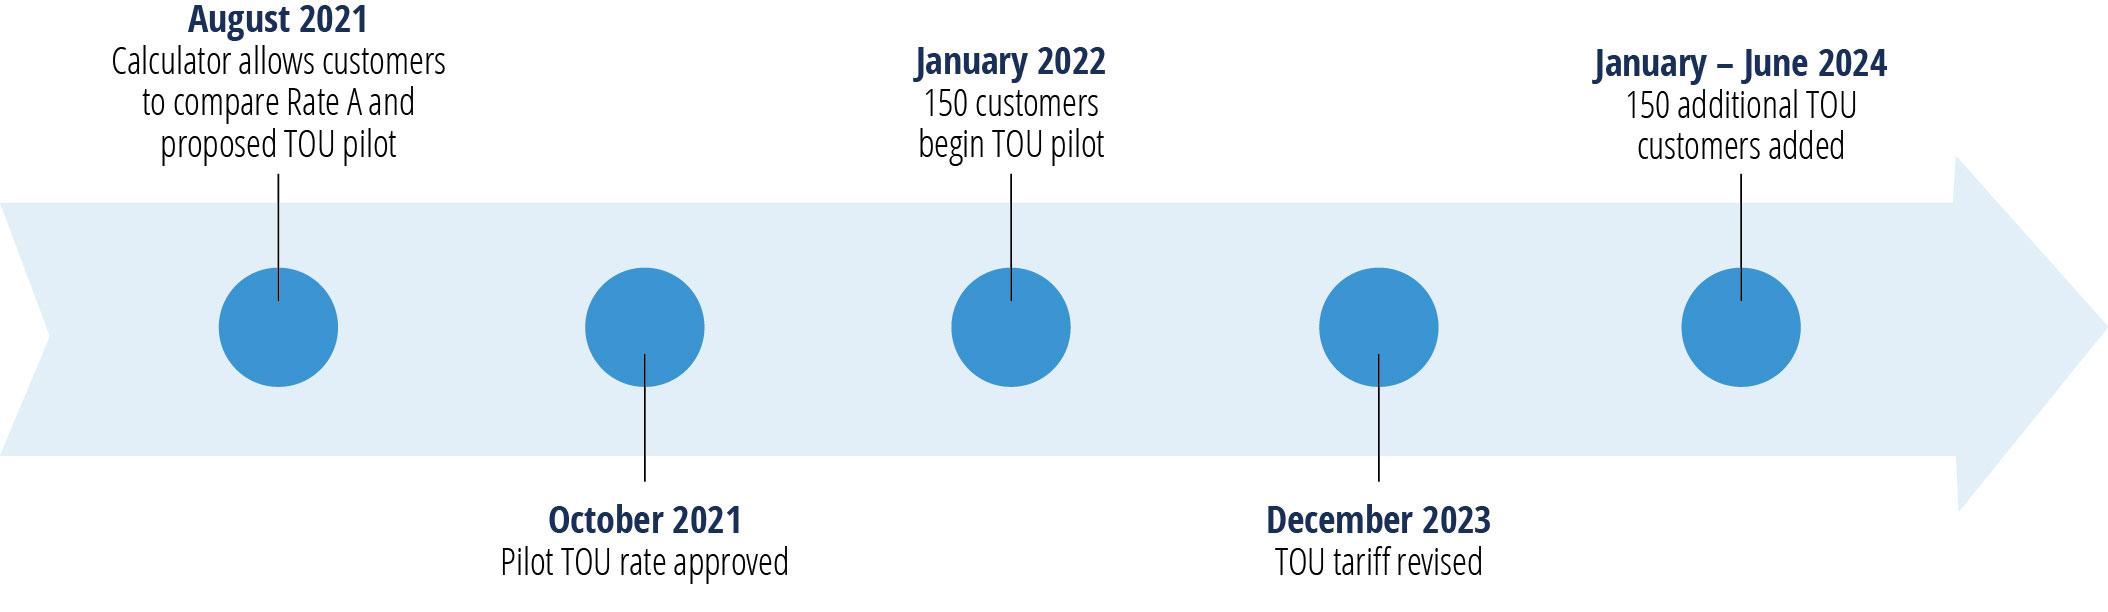
A little more than 1.3 percent of Belmont’s residential customers (150 customers) entered the pilot program in 2022. Based on the smoothness of the implementation, the Belmont Light Board voted to expand the pilot and admitted an additional 150 customers over the course of 2024. See timeline in Figure 3.
Looking specifically at these TOU customers’ load patterns, Daymark’s load research study compared hourly usage during peak and off-peak periods in both the summer and non-summer seasons and assessed how load profiles shifted in response to the rate design’s price signals. Technology-specific subgroups (e.g., PV, EV, BESS owners) were further disaggregated to understand how customer-side technologies affected peak demand and consumption patterns throughout the day. This approach allowed Belmont Light to visualize the impacts of customer behavior, technology adoption, and pricing incentives on system-wide load management.
Main Findings
The load research study delivered findings that describe system-wide behavior, patterns by rate class (residential, commercial, large power, municipal), impacts of technology (e.g., solar, BESS), and customer behavior changes derived from the TOU rate.
Systemwide, Belmont Light remains a summer-peaking utility, with its peaks reliably occurring between 5:00–7:00 pm and weather events strongly influencing peak days and overall seasonal profiles. Residential customers (not on TOU) displayed the strongest evening peak, a lower morning peak, and a significant gap between average use and maximum demand, leading to low load factors (~0.38). Municipal, commercial, and large power customers had expected earlier peaks (mid-morning to midday) and sharp weekday/weekend differences.
Customers with various energy technologies displayed unique load patterns.
- Solar: As shown in Figure 4, Customers with solar have reduced midday demand, creating “duck curve” effects.
- BESS: Customers with BESS shift load away from peak periods, flattening the profiles.
- EVs: Customers with EVs have peaks that are shifted later into the evening — between 7:00–10:00 pm — with some randomness in peak times.
- ASHPs: Customers with air source heat pumps saw increased peak demand during the winter months.
Technology and TOU Rate Findings
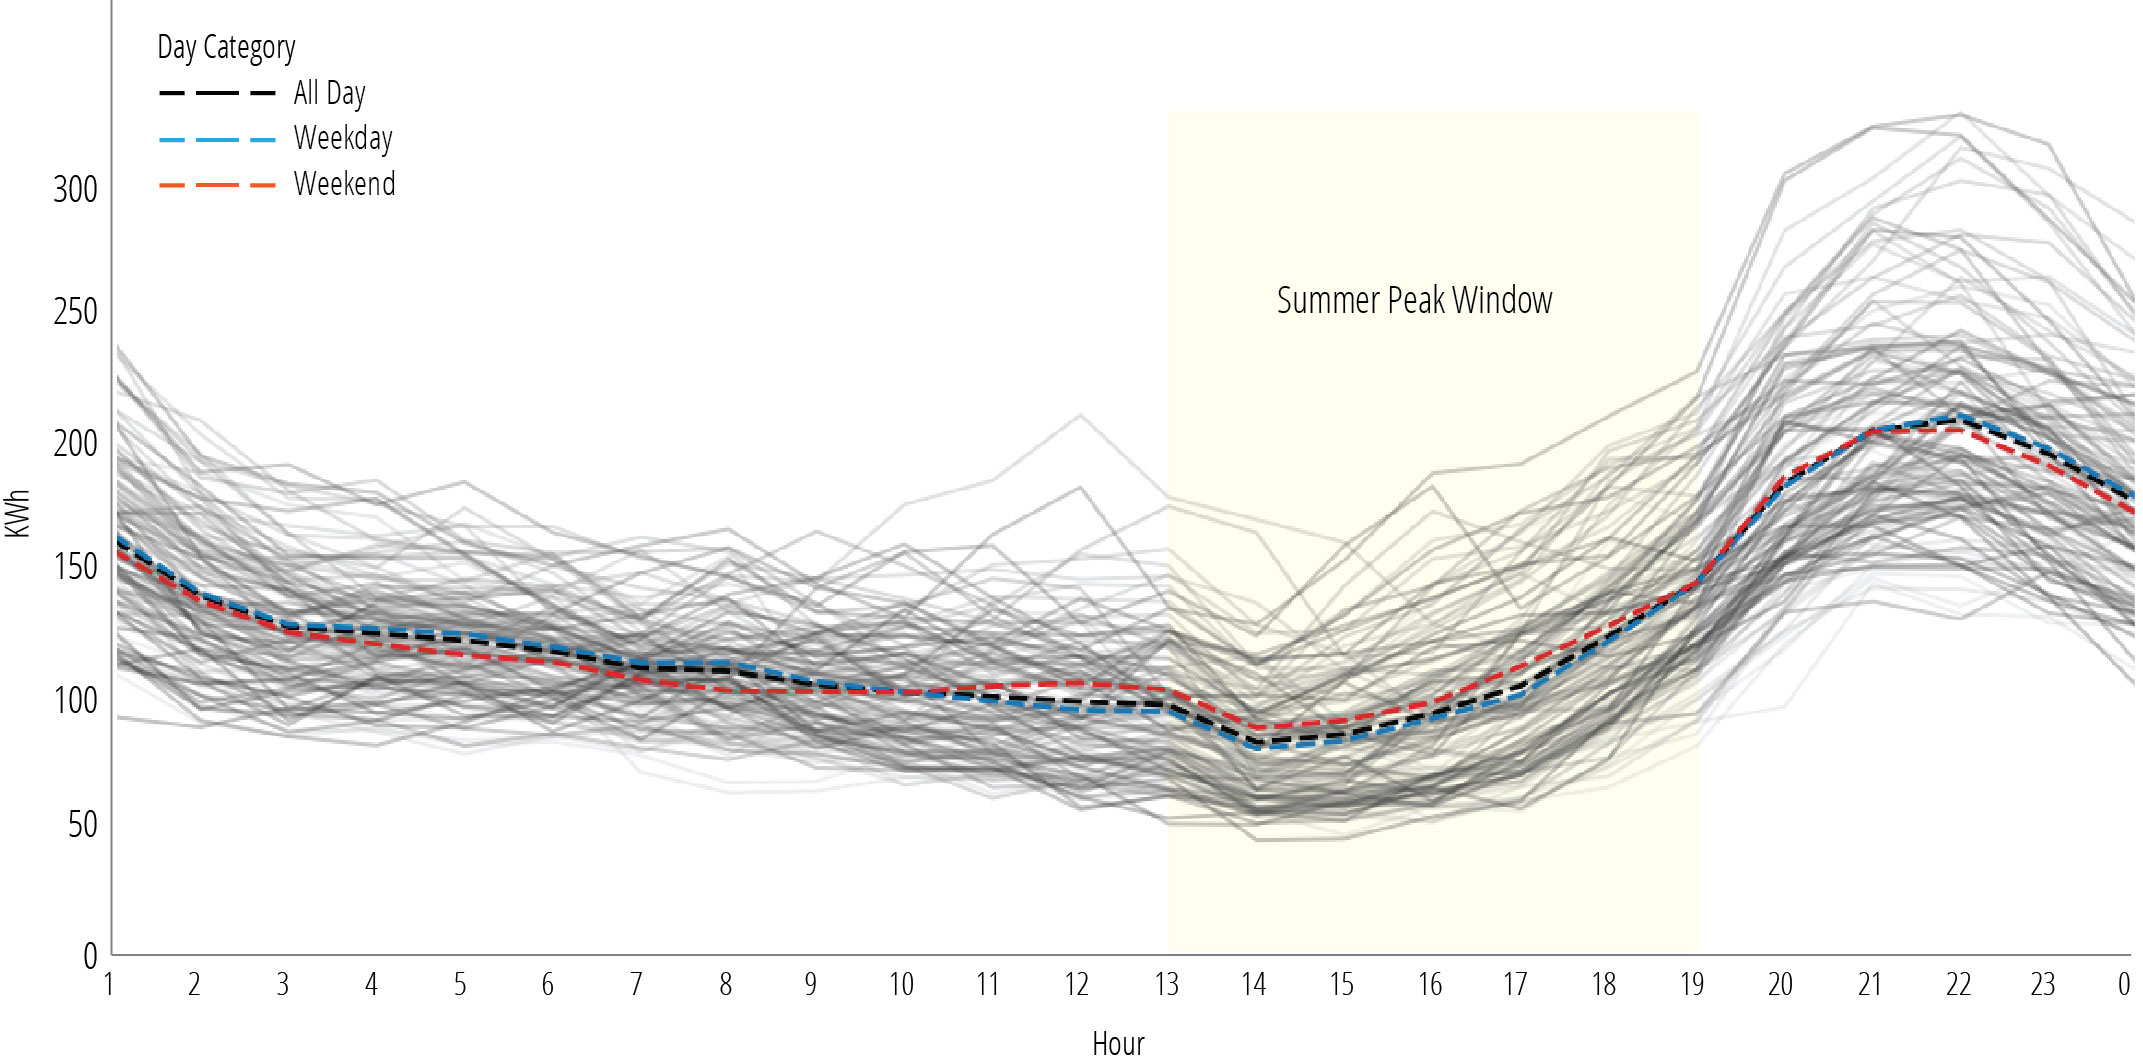
Customers on the TOU rate reliably reduced consumption during peak rate periods. As shown in Figure 5, in the summer peak window, the average load during peak hours was about 15 percent lower than in off-peak hours. In non-summer months, load during peak windows, 4:00–8:00 pm, was about 10 percent lower than adjacent off-peak hours.
- TOU participants delayed their evening peaks by one to five hours compared to standard Residential Rate A customers.
- Summer TOU load profiles showed sharp drops in consumption starting at 1:00 pm, with rebounds after 7:00 pm as can be seen in Figure 5. Non-summer TOU load profiles showed gradual reductions beginning at 4:00 pm, with delayed evening peaks around 9:00–10:00 pm.
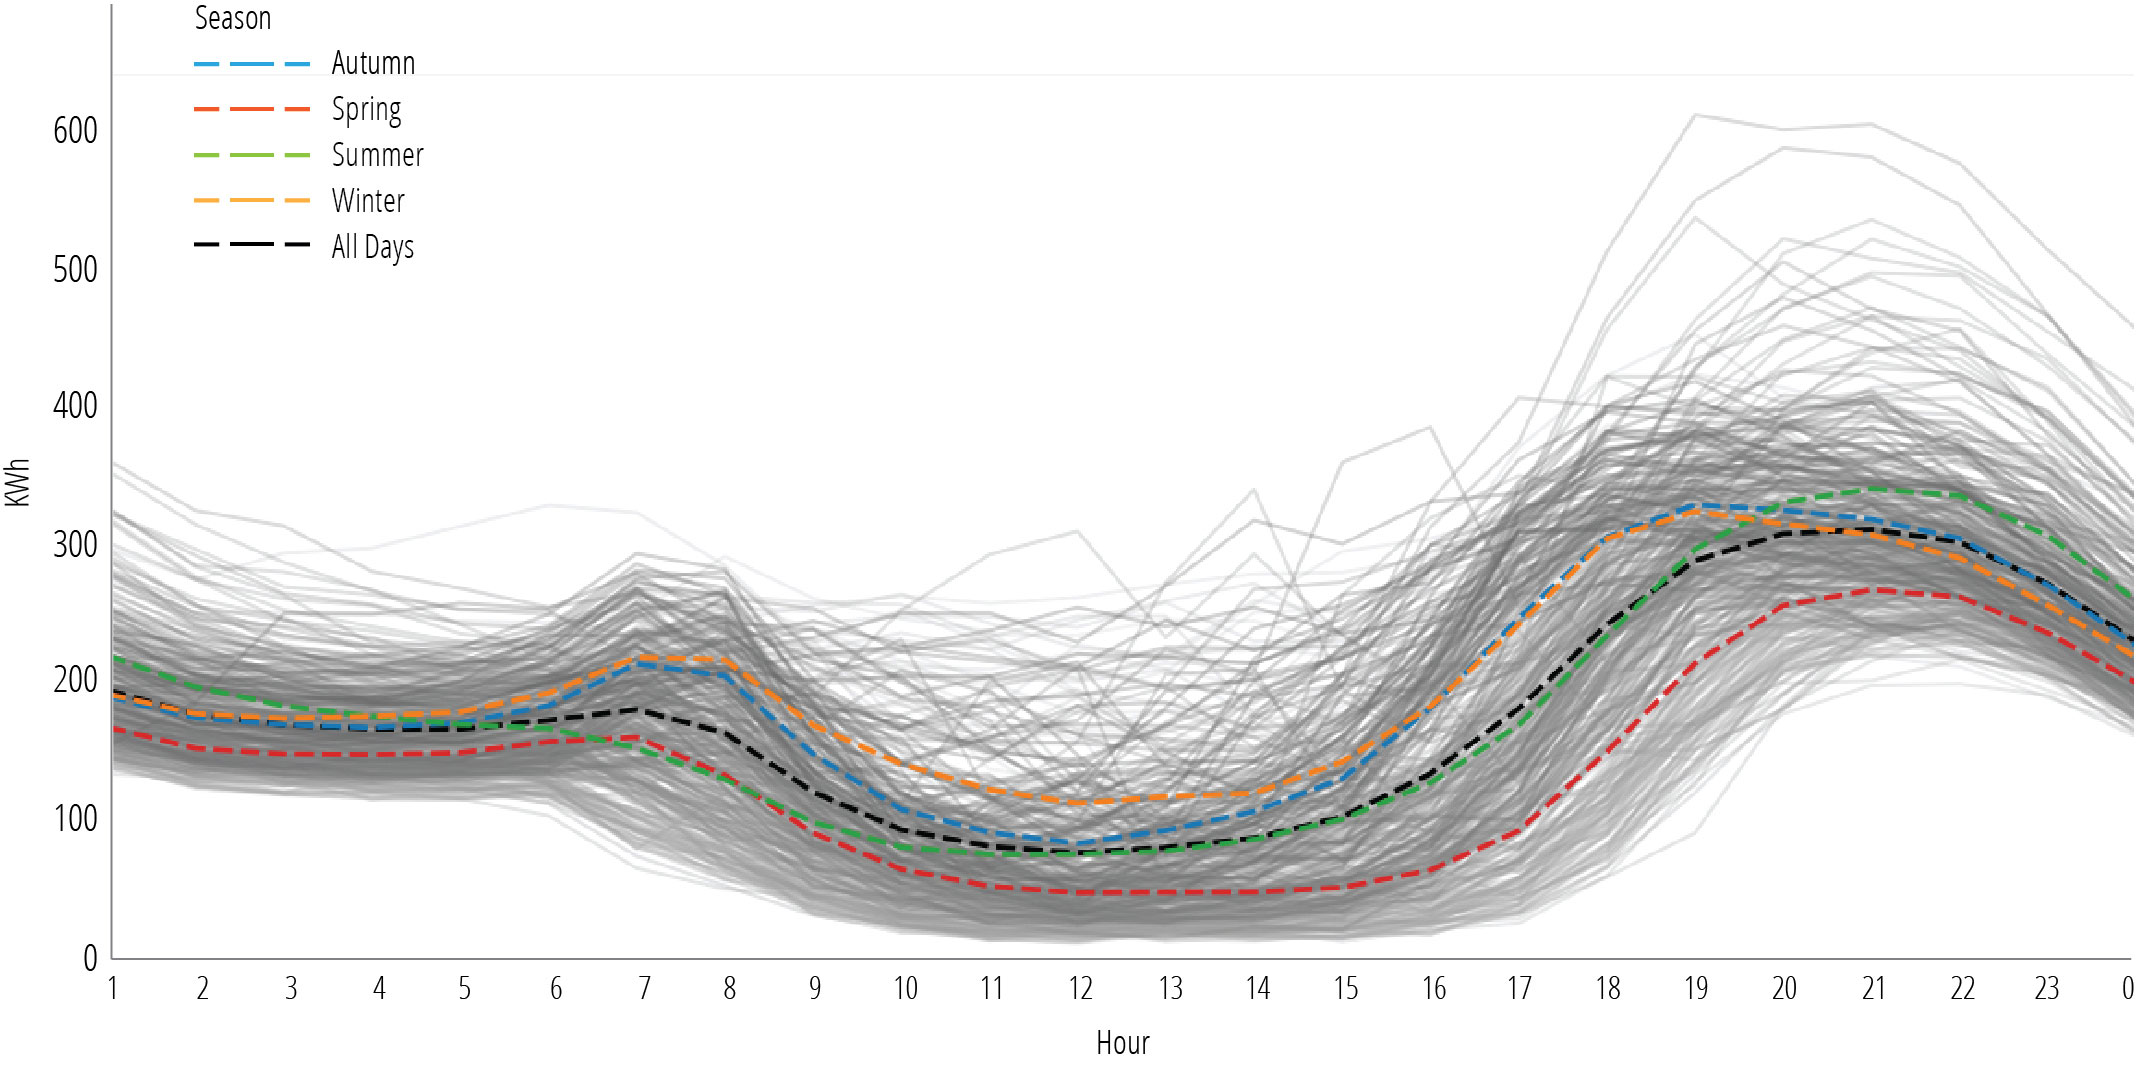
Technology-enhanced TOU customers exhibited even sharper load reductions and peak shifting. For example, TOU participants with BESS leveraged storage to manage consumption during peak pricing hours. Among all TOU participants, customers with both solar buy-back credits and BESS demonstrated pronounced and effective load-shifting behavior. As shown in Figure 6, which charts hourly consumption between June 1 and September 30, 2023, these customers consistently reduced their electricity consumption from the grid during the on-peak summer TOU hours (1:00–7:00 pm, shaded in yellow). Weekday and weekend averages both show a clear dip in consumption beginning just before 1:00 pm, followed by a steep increase immediately after 7:00 pm — a behavior that aligns strongly with the TOU price signal.
The average weekday profile (blue dashed line) dips below 5 kilowatt-hours during the peak period, compared to average consumption of 10–12 kWh in the morning and 8–15 kWh in the late evening, suggesting that these customers are strategically discharging their batteries to avoid purchasing electricity during expensive peak hours. This pattern is observed on weekends as well (red dashed line), indicating a consistent understanding of and response to the TOU structure.
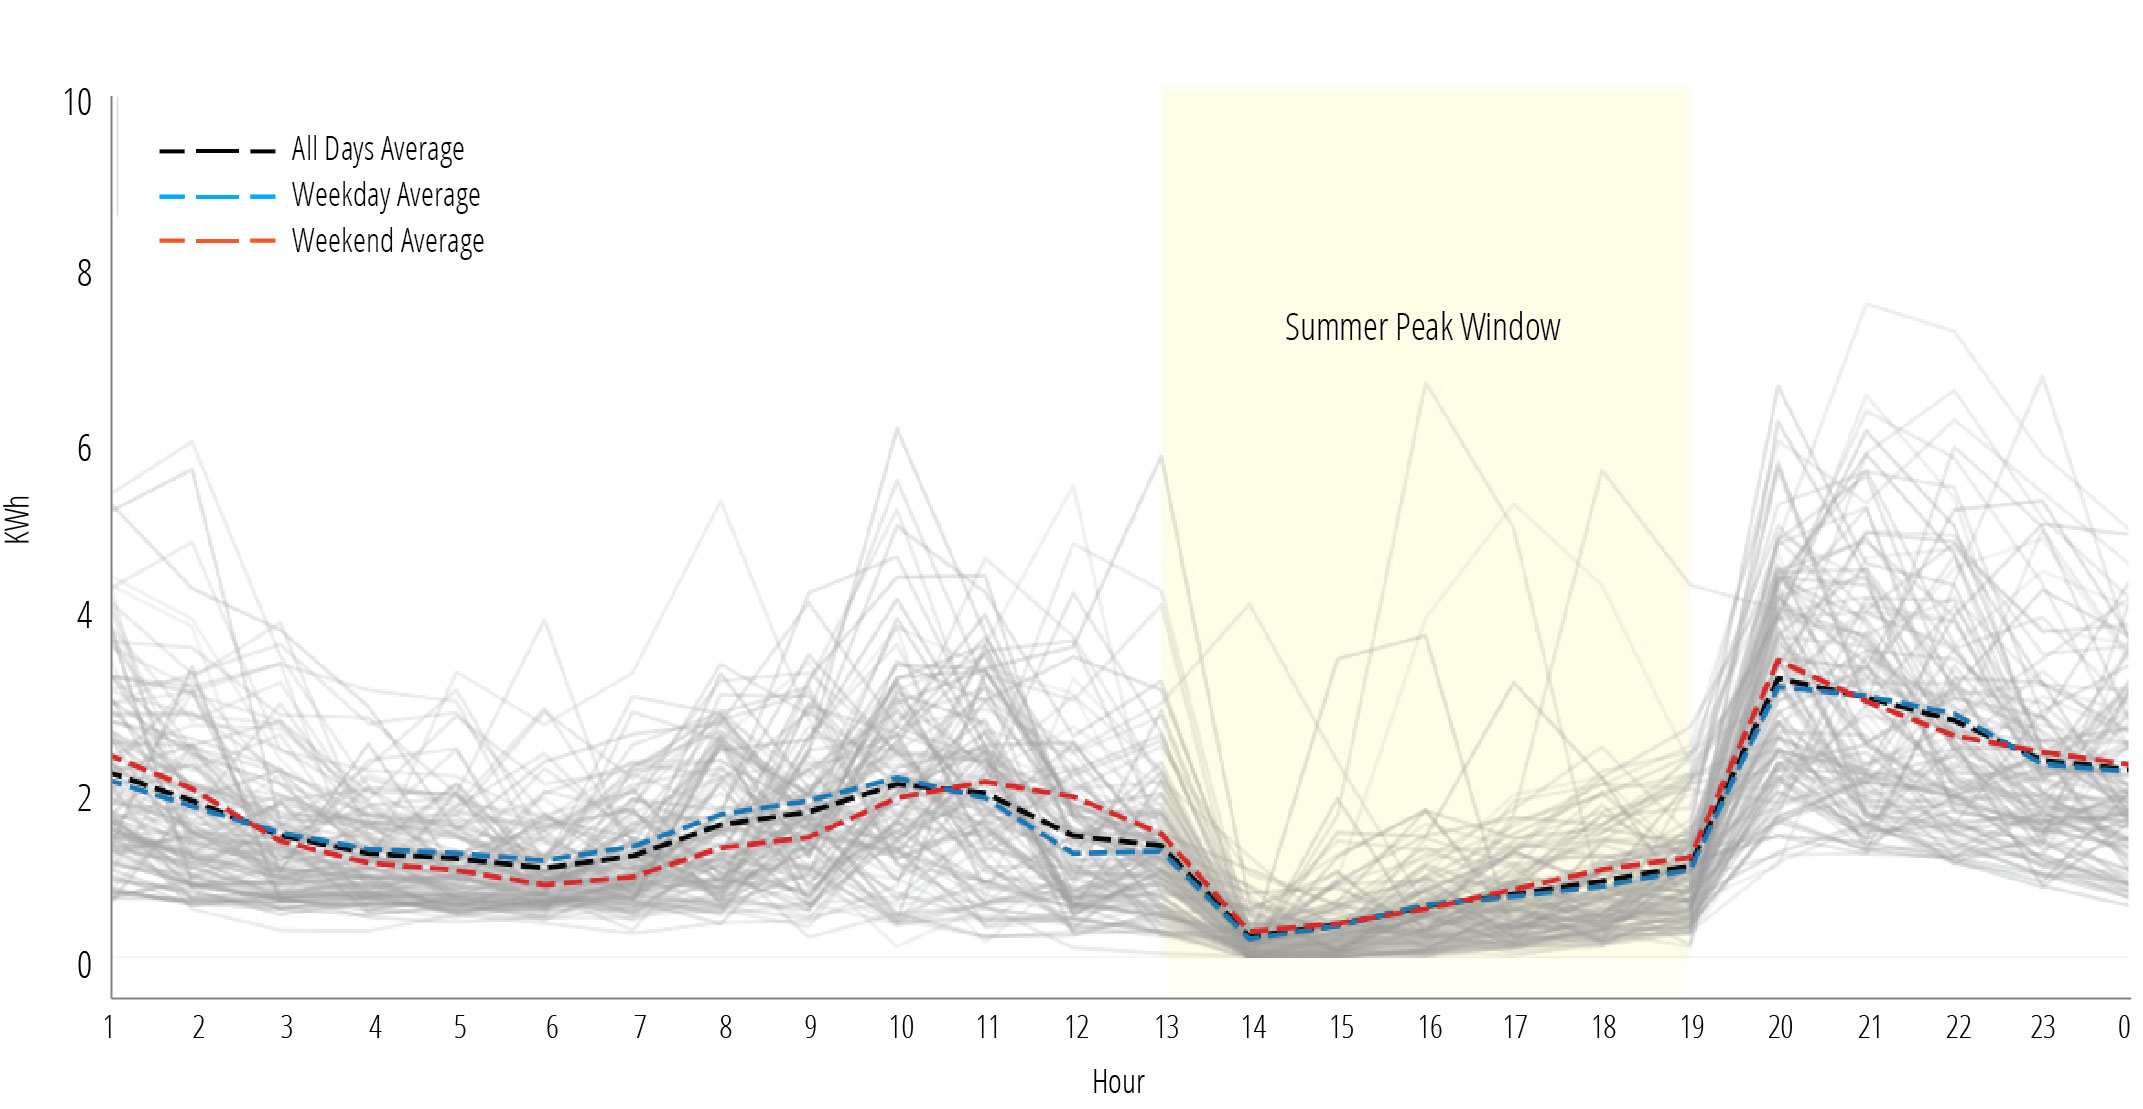
Moreover, the steep rebound after 7:00 pm — especially between 7:00 pm–9:00 pm — points to delayed household activity or active recharging of the battery systems using off-peak power. The smoothness of the average lines overlaid on the variability of individual daily curves also suggests that this is not accidental behavior, but a learned and intentional pattern repeated across days. These customers are clearly optimizing their usage in response to rate signals and leveraging BESS to flatten their demand curves, shift load out of peak periods, and maximize value under the buy-back TOU structure.
TOU Rate and Hour Changes
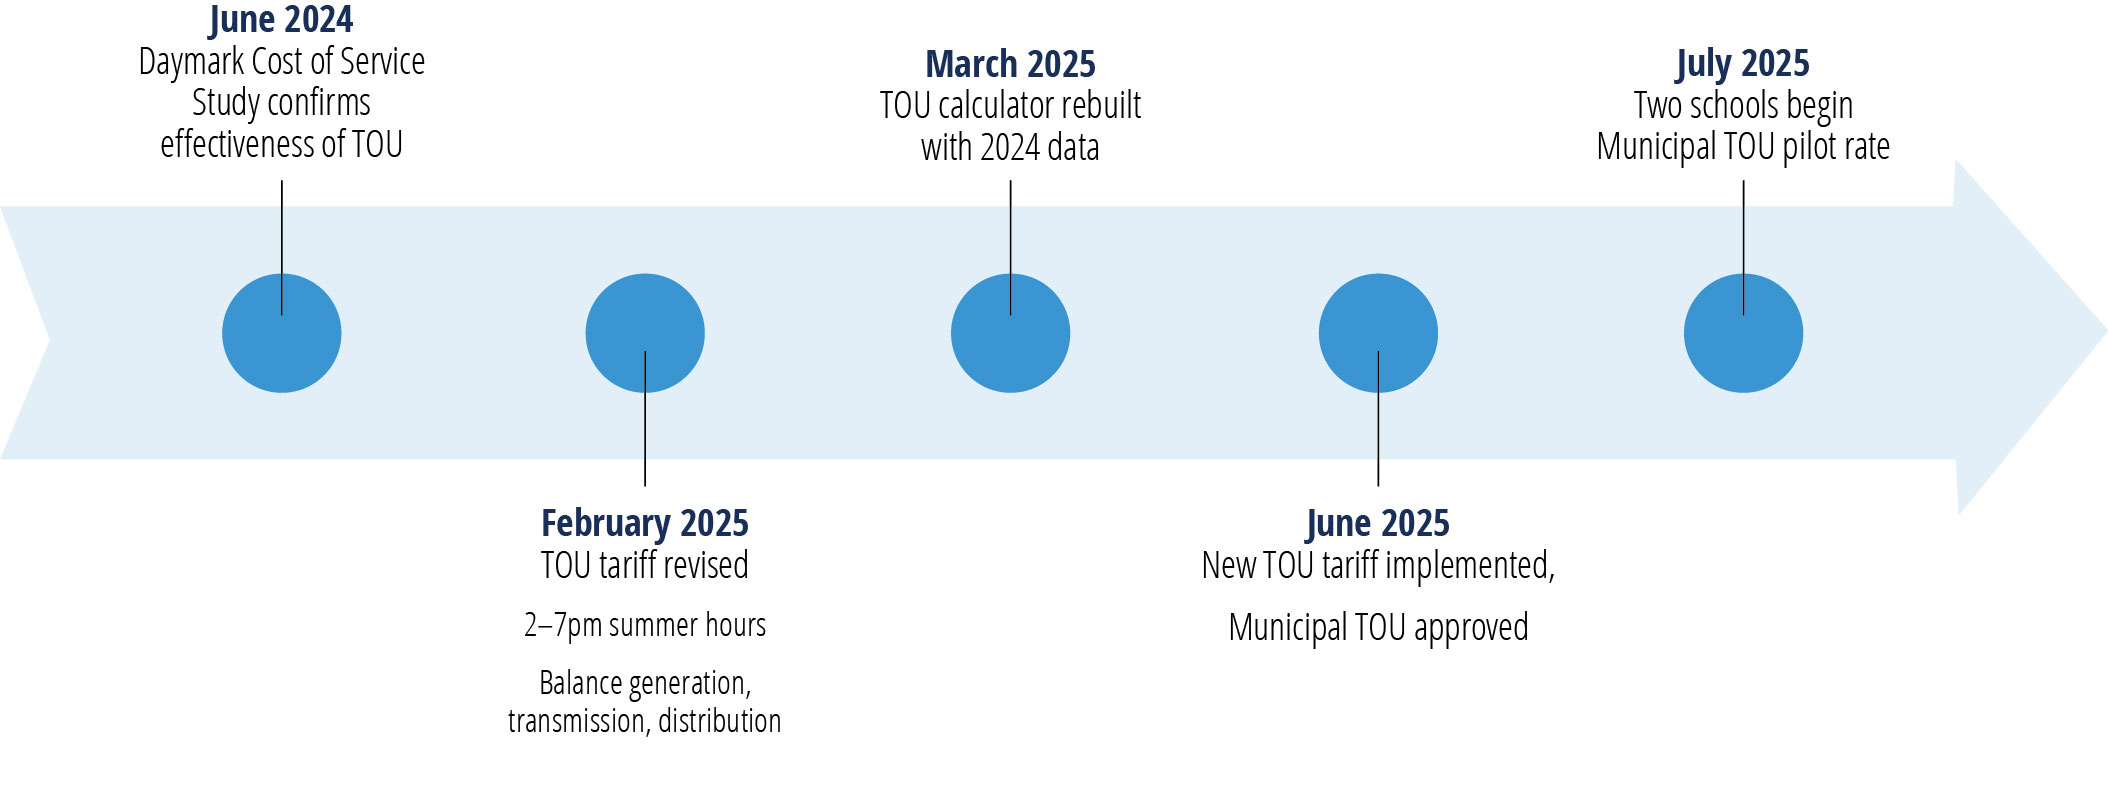
The TOU rate was clearly achieving its goal: reducing peak demand, thus saving Belmont Light on transmission and capacity costs. However, Daymark’s analysis provided several opportunities to capture further benefits to both customers and Belmont Light. First, recognizing that Belmont Light has not experienced a monthly summer peak between 1:00–2:00 pm in recent history (2018-2024), the analysis suggested that Belmont Light reduce its TOU summer peak hours from 1:00–7:00 pm to 2:00–7:00 pm. This allows TOU customers to pre-cool their homes for one additional hour without Belmont Light risking a monthly system peak. Second, across most rate classes, Belmont Light was collecting slightly too little for generation and transmission and slightly too much for distribution. On Spinale’s advice, the Board adjusted the TOU rate to match this slight rate imbalance and hour change. To support this latest TOU initiative, Belmont Light rebuilt the Rate A versus TOU rate comparison calculator based on 2024 AMI data. Third, a large municipal TOU pilot rate was created and implemented in July, expanding its peak shaving efforts to its two largest schools. Figure 7 shows the rough timeline for the expansion.
Continued Evaluation
Daymark’s 2024 load research study provided a snapshot of Belmont Light’s situation in 2023. Since the energy sector is evolving rapidly, there are already noticeable changes. For example, in 2024, Belmont Light experienced one unexpected and unusual monthly peak (between 10:00–11:00 am). Early 2025 saw frigid temperatures and record high winter average energy prices, catching much of New England off guard.
To stay current in this volatile environment, Belmont Light has already begun to address Daymark’s recommendations. For example, it revised the town’s street light rate to reflect the true cost to serve. As it did with the TOU rate, Belmont Light will consider balancing the generation, transmission, and distribution charges for all rate classes and may make other adjustments to rates in 2026.
Load research is essential for modern utilities seeking to navigate evolving system dynamics and customer needs. By analyzing detailed consumption data, particularly from AMI meters, utilities can uncover patterns in peak demand, seasonal shifts, and customer behavior. These insights form the foundation for equitable cost allocation, targeted rate design (such as TOU rates), and effective demand-side programs. As electrification accelerates, distributed energy resources expand, and large loads like data centers interconnect, load research becomes a critical tool for ensuring grid reliability, financial sustainability, and customer engagement.